Xarray 数据处理(1)
Contents
Xarray 数据处理(1)
主讲人:李显祥
大气科学学院
1. DataArray
import xarray as xr
import numpy as np
import pandas as pd
import matplotlib.pyplot as plt

#xr.set_options(display_style="html")
%matplotlib inline
xr.__version__ #show_versions()
'0.16.2'
一个简单的没有维度和坐标的 DataArray
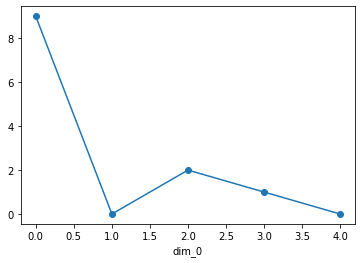
da = xr.DataArray([9, 0, 2, 1, 0])
da
<xarray.DataArray (dim_0: 5)>
array([9, 0, 2, 1, 0])
Dimensions without coordinates: dim_0
xarray.DataArray
- dim_0: 5
- 9 0 2 1 0
array([9, 0, 2, 1, 0])
da.plot(marker='o')
[<matplotlib.lines.Line2D at 0x7fed2827f990>]
加上维度名字
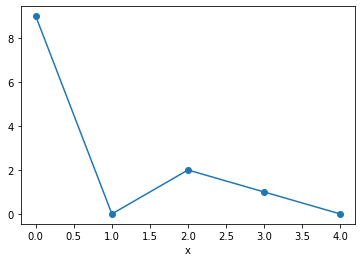
da = xr.DataArray([9, 0, 2, 1, 0], dims=['x'])
da
<xarray.DataArray (x: 5)>
array([9, 0, 2, 1, 0])
Dimensions without coordinates: x
xarray.DataArray
- x: 5
- 9 0 2 1 0
array([9, 0, 2, 1, 0])
da.plot(marker='o')
[<matplotlib.lines.Line2D at 0x7fed28568b10>]
如果加上坐标,情况会如何呢?
import pandas as pd
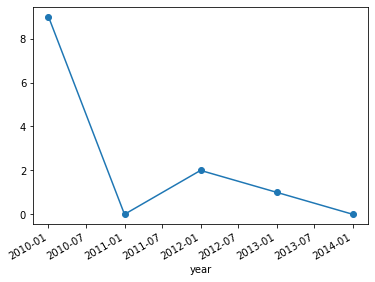
da = xr.DataArray([9, 0, 2, 1, 0],
                  dims=['year'],
                  coords={'year':pd.to_datetime(['2010','2011','2012','2013','2014'])})
da
<xarray.DataArray (year: 5)>
array([9, 0, 2, 1, 0])
Coordinates:
  * year     (year) datetime64[ns] 2010-01-01 2011-01-01 ... 2014-01-01
xarray.DataArray
- year: 5
- 9 0 2 1 0
array([9, 0, 2, 1, 0])
- year(year)datetime64[ns]2010-01-01 ... 2014-01-01
array(['2010-01-01T00:00:00.000000000', '2011-01-01T00:00:00.000000000',
       '2012-01-01T00:00:00.000000000', '2013-01-01T00:00:00.000000000',
       '2014-01-01T00:00:00.000000000'], dtype='datetime64[ns]')
f,ax = plt.subplots()
da.plot(ax=ax,marker='o')
[<matplotlib.lines.Line2D at 0x7fed2855ac90>]
多维 DataArray
S = [[1,2,4],[5,6,7]]
levels = [0,1]
date = pd.to_datetime(['2015-09-01','2015-10-01','2015-11-01'])

da = xr.DataArray(S, dims=['level', 'date'],
                           coords={'level': levels,
                                   'date': date},
                 name='da')
da
<xarray.DataArray 'da' (level: 2, date: 3)>
array([[1, 2, 4],
       [5, 6, 7]])
Coordinates:
  * level    (level) int64 0 1
  * date     (date) datetime64[ns] 2015-09-01 2015-10-01 2015-11-01
xarray.DataArray
'da'
- level: 2
- date: 3
- 1 2 4 5 6 7
array([[1, 2, 4], [5, 6, 7]]) - level(level)int640 1
array([0, 1])
- date(date)datetime64[ns]2015-09-01 2015-10-01 2015-11-01
array(['2015-09-01T00:00:00.000000000', '2015-10-01T00:00:00.000000000',
       '2015-11-01T00:00:00.000000000'], dtype='datetime64[ns]')
dataarray和dataset可以转换为pandas.dataframe。
da.to_dataframe()
| da | ||
|---|---|---|
| level | date | |
| 0 | 2015-09-01 | 1 |
| 2015-10-01 | 2 | |
| 2015-11-01 | 4 | |
| 1 | 2015-09-01 | 5 |
| 2015-10-01 | 6 | |
| 2015-11-01 | 7 |
#air_temp = xr.tutorial.load_dataset('air_temperature')
air_temp = xr.open_dataset('air_temperature.nc')
air_temp.air
<xarray.DataArray 'air' (time: 2920, lat: 25, lon: 53)>
[3869000 values with dtype=float32]
Coordinates:
  * lat      (lat) float32 75.0 72.5 70.0 67.5 65.0 ... 25.0 22.5 20.0 17.5 15.0
  * lon      (lon) float32 200.0 202.5 205.0 207.5 ... 322.5 325.0 327.5 330.0
  * time     (time) datetime64[ns] 2013-01-01 ... 2014-12-31T18:00:00
Attributes:
    long_name:     4xDaily Air temperature at sigma level 995
    units:         degK
    precision:     2
    GRIB_id:       11
    GRIB_name:     TMP
    var_desc:      Air temperature
    dataset:       NMC Reanalysis
    level_desc:    Surface
    statistic:     Individual Obs
    parent_stat:   Other
    actual_range:  [185.16 322.1 ]
xarray.DataArray
'air'
- time: 2920
- lat: 25
- lon: 53
- ...
[3869000 values with dtype=float32]
- lat(lat)float3275.0 72.5 70.0 ... 20.0 17.5 15.0
- standard_name :
- latitude
- long_name :
- Latitude
- units :
- degrees_north
- axis :
- Y
array([75. , 72.5, 70. , 67.5, 65. , 62.5, 60. , 57.5, 55. , 52.5, 50. , 47.5, 45. , 42.5, 40. , 37.5, 35. , 32.5, 30. , 27.5, 25. , 22.5, 20. , 17.5, 15. ], dtype=float32) - lon(lon)float32200.0 202.5 205.0 ... 327.5 330.0
- standard_name :
- longitude
- long_name :
- Longitude
- units :
- degrees_east
- axis :
- X
array([200. , 202.5, 205. , 207.5, 210. , 212.5, 215. , 217.5, 220. , 222.5, 225. , 227.5, 230. , 232.5, 235. , 237.5, 240. , 242.5, 245. , 247.5, 250. , 252.5, 255. , 257.5, 260. , 262.5, 265. , 267.5, 270. , 272.5, 275. , 277.5, 280. , 282.5, 285. , 287.5, 290. , 292.5, 295. , 297.5, 300. , 302.5, 305. , 307.5, 310. , 312.5, 315. , 317.5, 320. , 322.5, 325. , 327.5, 330. ], dtype=float32) - time(time)datetime64[ns]2013-01-01 ... 2014-12-31T18:00:00
- standard_name :
- time
- long_name :
- Time
array(['2013-01-01T00:00:00.000000000', '2013-01-01T06:00:00.000000000',
       '2013-01-01T12:00:00.000000000', ..., '2014-12-31T06:00:00.000000000',
       '2014-12-31T12:00:00.000000000', '2014-12-31T18:00:00.000000000'],
      dtype='datetime64[ns]')
- long_name :
- 4xDaily Air temperature at sigma level 995
- units :
- degK
- precision :
- 2
- GRIB_id :
- 11
- GRIB_name :
- TMP
- var_desc :
- Air temperature
- dataset :
- NMC Reanalysis
- level_desc :
- Surface
- statistic :
- Individual Obs
- parent_stat :
- Other
- actual_range :
- [185.16 322.1 ]
2. DataSet
air_temp
<xarray.Dataset>
Dimensions:  (lat: 25, lon: 53, time: 2920)
Coordinates:
  * lat      (lat) float32 75.0 72.5 70.0 67.5 65.0 ... 25.0 22.5 20.0 17.5 15.0
  * lon      (lon) float32 200.0 202.5 205.0 207.5 ... 322.5 325.0 327.5 330.0
  * time     (time) datetime64[ns] 2013-01-01 ... 2014-12-31T18:00:00
Data variables:
    air      (time, lat, lon) float32 ...
Attributes:
    Conventions:  COARDS
    title:        4x daily NMC reanalysis (1948)
    description:  Data is from NMC initialized reanalysis\n(4x/day).  These a...
    platform:     Model
    references:   http://www.esrl.noaa.gov/psd/data/gridded/data.ncep.reanaly...
xarray.Dataset
- lat: 25
- lon: 53
- time: 2920
- lat(lat)float3275.0 72.5 70.0 ... 20.0 17.5 15.0
- standard_name :
- latitude
- long_name :
- Latitude
- units :
- degrees_north
- axis :
- Y
array([75. , 72.5, 70. , 67.5, 65. , 62.5, 60. , 57.5, 55. , 52.5, 50. , 47.5, 45. , 42.5, 40. , 37.5, 35. , 32.5, 30. , 27.5, 25. , 22.5, 20. , 17.5, 15. ], dtype=float32) - lon(lon)float32200.0 202.5 205.0 ... 327.5 330.0
- standard_name :
- longitude
- long_name :
- Longitude
- units :
- degrees_east
- axis :
- X
array([200. , 202.5, 205. , 207.5, 210. , 212.5, 215. , 217.5, 220. , 222.5, 225. , 227.5, 230. , 232.5, 235. , 237.5, 240. , 242.5, 245. , 247.5, 250. , 252.5, 255. , 257.5, 260. , 262.5, 265. , 267.5, 270. , 272.5, 275. , 277.5, 280. , 282.5, 285. , 287.5, 290. , 292.5, 295. , 297.5, 300. , 302.5, 305. , 307.5, 310. , 312.5, 315. , 317.5, 320. , 322.5, 325. , 327.5, 330. ], dtype=float32) - time(time)datetime64[ns]2013-01-01 ... 2014-12-31T18:00:00
- standard_name :
- time
- long_name :
- Time
array(['2013-01-01T00:00:00.000000000', '2013-01-01T06:00:00.000000000',
       '2013-01-01T12:00:00.000000000', ..., '2014-12-31T06:00:00.000000000',
       '2014-12-31T12:00:00.000000000', '2014-12-31T18:00:00.000000000'],
      dtype='datetime64[ns]')
- air(time, lat, lon)float32...
- long_name :
- 4xDaily Air temperature at sigma level 995
- units :
- degK
- precision :
- 2
- GRIB_id :
- 11
- GRIB_name :
- TMP
- var_desc :
- Air temperature
- dataset :
- NMC Reanalysis
- level_desc :
- Surface
- statistic :
- Individual Obs
- parent_stat :
- Other
- actual_range :
- [185.16 322.1 ]
[3869000 values with dtype=float32]
- Conventions :
- COARDS
- title :
- 4x daily NMC reanalysis (1948)
- description :
- Data is from NMC initialized reanalysis (4x/day). These are the 0.9950 sigma level values.
- platform :
- Model
- references :
- http://www.esrl.noaa.gov/psd/data/gridded/data.ncep.reanalysis.html
坐标 vs. 变量
air_temp*100
<xarray.Dataset>
Dimensions:  (lat: 25, lon: 53, time: 2920)
Coordinates:
  * lat      (lat) float32 75.0 72.5 70.0 67.5 65.0 ... 25.0 22.5 20.0 17.5 15.0
  * lon      (lon) float32 200.0 202.5 205.0 207.5 ... 322.5 325.0 327.5 330.0
  * time     (time) datetime64[ns] 2013-01-01 ... 2014-12-31T18:00:00
Data variables:
    air      (time, lat, lon) float32 2.412e+04 2.425e+04 ... 2.957e+04
Attributes:
    Conventions:  COARDS
    title:        4x daily NMC reanalysis (1948)
    description:  Data is from NMC initialized reanalysis\n(4x/day).  These a...
    platform:     Model
    references:   http://www.esrl.noaa.gov/psd/data/gridded/data.ncep.reanaly...
xarray.Dataset
- lat: 25
- lon: 53
- time: 2920
- lat(lat)float3275.0 72.5 70.0 ... 20.0 17.5 15.0
- standard_name :
- latitude
- long_name :
- Latitude
- units :
- degrees_north
- axis :
- Y
array([75. , 72.5, 70. , 67.5, 65. , 62.5, 60. , 57.5, 55. , 52.5, 50. , 47.5, 45. , 42.5, 40. , 37.5, 35. , 32.5, 30. , 27.5, 25. , 22.5, 20. , 17.5, 15. ], dtype=float32) - lon(lon)float32200.0 202.5 205.0 ... 327.5 330.0
- standard_name :
- longitude
- long_name :
- Longitude
- units :
- degrees_east
- axis :
- X
array([200. , 202.5, 205. , 207.5, 210. , 212.5, 215. , 217.5, 220. , 222.5, 225. , 227.5, 230. , 232.5, 235. , 237.5, 240. , 242.5, 245. , 247.5, 250. , 252.5, 255. , 257.5, 260. , 262.5, 265. , 267.5, 270. , 272.5, 275. , 277.5, 280. , 282.5, 285. , 287.5, 290. , 292.5, 295. , 297.5, 300. , 302.5, 305. , 307.5, 310. , 312.5, 315. , 317.5, 320. , 322.5, 325. , 327.5, 330. ], dtype=float32) - time(time)datetime64[ns]2013-01-01 ... 2014-12-31T18:00:00
- standard_name :
- time
- long_name :
- Time
array(['2013-01-01T00:00:00.000000000', '2013-01-01T06:00:00.000000000',
       '2013-01-01T12:00:00.000000000', ..., '2014-12-31T06:00:00.000000000',
       '2014-12-31T12:00:00.000000000', '2014-12-31T18:00:00.000000000'],
      dtype='datetime64[ns]')
- air(time, lat, lon)float322.412e+04 2.425e+04 ... 2.957e+04
array([[[24120.   , 24250.   , 24350.   , ..., 23279.998, 23550.   ,
         23860.   ],
        [24379.998, 24450.   , 24470.   , ..., 23279.998, 23529.998,
         23929.998],
        [25000.   , 24979.998, 24889.   , ..., 23320.   , 23639.   ,
         24170.   ],
        ...,
        [29660.   , 29619.998, 29640.   , ..., 29540.   , 29510.   ,
         29469.998],
        [29590.   , 29619.998, 29679.   , ..., 29590.   , 29590.   ,
         29519.998],
        [29629.   , 29679.   , 29710.   , ..., 29690.   , 29679.   ,
         29660.   ]],

       [[24210.   , 24270.   , 24310.   , ..., 23200.   , 23360.   ,
         23579.998],
        [24360.   , 24410.   , 24420.   , ..., 23100.   , 23250.   ,
         23570.   ],
        [25320.   , 25289.   , 25210.   , ..., 23079.998, 23339.   ,
         23850.   ],
...
        [29369.   , 29388.998, 29538.998, ..., 29509.   , 29469.   ,
         29429.   ],
        [29629.   , 29719.   , 29759.   , ..., 29529.   , 29509.   ,
         29438.998],
        [29779.   , 29838.998, 29849.   , ..., 29569.   , 29549.   ,
         29519.   ]],

       [[24509.   , 24429.   , 24329.   , ..., 24168.998, 24149.   ,
         24179.   ],
        [24989.   , 24929.   , 24839.   , ..., 23959.   , 24029.   ,
         24168.998],
        [26299.   , 26219.   , 26138.998, ..., 23989.   , 24259.   ,
         24629.   ],
        ...,
        [29379.   , 29369.   , 29509.   , ..., 29529.   , 29509.   ,
         29469.   ],
        [29609.   , 29688.998, 29719.   , ..., 29569.   , 29569.   ,
         29519.   ],
        [29769.   , 29809.   , 29809.   , ..., 29649.   , 29619.   ,
         29569.   ]]], dtype=float32)
- Conventions :
- COARDS
- title :
- 4x daily NMC reanalysis (1948)
- description :
- Data is from NMC initialized reanalysis (4x/day). These are the 0.9950 sigma level values.
- platform :
- Model
- references :
- http://www.esrl.noaa.gov/psd/data/gridded/data.ncep.reanalysis.html
操作是针对数据变量的,坐标本身不变。
如果要改变坐标,需要用 .assign_coords 方法:
air_temp_new = air_temp.assign_coords({'lon':(((air_temp.lon+180)%360)-180)})
# 或者
# air_temp_new = air_temp.assign_coords(lon = (((air_temp.lon+180)%360)-180))
air_temp_new
<xarray.Dataset>
Dimensions:  (lat: 25, lon: 53, time: 2920)
Coordinates:
  * lat      (lat) float32 75.0 72.5 70.0 67.5 65.0 ... 25.0 22.5 20.0 17.5 15.0
  * lon      (lon) float32 -160.0 -157.5 -155.0 -152.5 ... -35.0 -32.5 -30.0
  * time     (time) datetime64[ns] 2013-01-01 ... 2014-12-31T18:00:00
Data variables:
    air      (time, lat, lon) float32 241.2 242.5 243.5 ... 296.5 296.2 295.7
Attributes:
    Conventions:  COARDS
    title:        4x daily NMC reanalysis (1948)
    description:  Data is from NMC initialized reanalysis\n(4x/day).  These a...
    platform:     Model
    references:   http://www.esrl.noaa.gov/psd/data/gridded/data.ncep.reanaly...
xarray.Dataset
- lat: 25
- lon: 53
- time: 2920
- lat(lat)float3275.0 72.5 70.0 ... 20.0 17.5 15.0
- standard_name :
- latitude
- long_name :
- Latitude
- units :
- degrees_north
- axis :
- Y
array([75. , 72.5, 70. , 67.5, 65. , 62.5, 60. , 57.5, 55. , 52.5, 50. , 47.5, 45. , 42.5, 40. , 37.5, 35. , 32.5, 30. , 27.5, 25. , 22.5, 20. , 17.5, 15. ], dtype=float32) - lon(lon)float32-160.0 -157.5 ... -32.5 -30.0
array([-160. , -157.5, -155. , -152.5, -150. , -147.5, -145. , -142.5, -140. , -137.5, -135. , -132.5, -130. , -127.5, -125. , -122.5, -120. , -117.5, -115. , -112.5, -110. , -107.5, -105. , -102.5, -100. , -97.5, -95. , -92.5, -90. , -87.5, -85. , -82.5, -80. , -77.5, -75. , -72.5, -70. , -67.5, -65. , -62.5, -60. , -57.5, -55. , -52.5, -50. , -47.5, -45. , -42.5, -40. , -37.5, -35. , -32.5, -30. ], dtype=float32) - time(time)datetime64[ns]2013-01-01 ... 2014-12-31T18:00:00
- standard_name :
- time
- long_name :
- Time
array(['2013-01-01T00:00:00.000000000', '2013-01-01T06:00:00.000000000',
       '2013-01-01T12:00:00.000000000', ..., '2014-12-31T06:00:00.000000000',
       '2014-12-31T12:00:00.000000000', '2014-12-31T18:00:00.000000000'],
      dtype='datetime64[ns]')
- air(time, lat, lon)float32241.2 242.5 243.5 ... 296.2 295.7
- long_name :
- 4xDaily Air temperature at sigma level 995
- units :
- degK
- precision :
- 2
- GRIB_id :
- 11
- GRIB_name :
- TMP
- var_desc :
- Air temperature
- dataset :
- NMC Reanalysis
- level_desc :
- Surface
- statistic :
- Individual Obs
- parent_stat :
- Other
- actual_range :
- [185.16 322.1 ]
array([[[241.2    , 242.5    , ..., 235.5    , 238.59999],
        [243.79999, 244.5    , ..., 235.29999, 239.29999],
        ...,
        [295.9    , 296.19998, ..., 295.9    , 295.19998],
        [296.29   , 296.79   , ..., 296.79   , 296.6    ]],

       [[242.09999, 242.7    , ..., 233.59999, 235.79999],
        [243.59999, 244.09999, ..., 232.5    , 235.7    ],
        ...,
        [296.19998, 296.69998, ..., 295.5    , 295.1    ],
        [296.29   , 297.19998, ..., 296.4    , 296.6    ]],

       ...,

       [[245.79   , 244.79   , ..., 243.98999, 244.79   ],
        [249.89   , 249.29   , ..., 242.48999, 244.29   ],
        ...,
        [296.29   , 297.19   , ..., 295.09   , 294.38998],
        [297.79   , 298.38998, ..., 295.49   , 295.19   ]],

       [[245.09   , 244.29   , ..., 241.48999, 241.79   ],
        [249.89   , 249.29   , ..., 240.29   , 241.68999],
        ...,
        [296.09   , 296.88998, ..., 295.69   , 295.19   ],
        [297.69   , 298.09   , ..., 296.19   , 295.69   ]]], dtype=float32)
- Conventions :
- COARDS
- title :
- 4x daily NMC reanalysis (1948)
- description :
- Data is from NMC initialized reanalysis (4x/day). These are the 0.9950 sigma level values.
- platform :
- Model
- references :
- http://www.esrl.noaa.gov/psd/data/gridded/data.ncep.reanalysis.html
3. 数组访问方法
air_temp.air[0,0,0]
# 等同于
#air_temp.air.isel(lat=0,lon=0,time=0)
<xarray.DataArray 'air' ()>
array(241.2, dtype=float32)
Coordinates:
    lat      float32 75.0
    lon      float32 200.0
    time     datetime64[ns] 2013-01-01
Attributes:
    long_name:     4xDaily Air temperature at sigma level 995
    units:         degK
    precision:     2
    GRIB_id:       11
    GRIB_name:     TMP
    var_desc:      Air temperature
    dataset:       NMC Reanalysis
    level_desc:    Surface
    statistic:     Individual Obs
    parent_stat:   Other
    actual_range:  [185.16 322.1 ]
xarray.DataArray
'air'
- 241.2
array(241.2, dtype=float32)
- lat()float3275.0
- standard_name :
- latitude
- long_name :
- Latitude
- units :
- degrees_north
- axis :
- Y
array(75., dtype=float32)
- lon()float32200.0
- standard_name :
- longitude
- long_name :
- Longitude
- units :
- degrees_east
- axis :
- X
array(200., dtype=float32)
- time()datetime64[ns]2013-01-01
- standard_name :
- time
- long_name :
- Time
array('2013-01-01T00:00:00.000000000', dtype='datetime64[ns]')
- long_name :
- 4xDaily Air temperature at sigma level 995
- units :
- degK
- precision :
- 2
- GRIB_id :
- 11
- GRIB_name :
- TMP
- var_desc :
- Air temperature
- dataset :
- NMC Reanalysis
- level_desc :
- Surface
- statistic :
- Individual Obs
- parent_stat :
- Other
- actual_range :
- [185.16 322.1 ]
air_temp.air.sel(lat=50,lon=300,time='2013-12-01T00:00:00')
<xarray.DataArray 'air' ()>
array(265.4, dtype=float32)
Coordinates:
    lat      float32 50.0
    lon      float32 300.0
    time     datetime64[ns] 2013-12-01
Attributes:
    long_name:     4xDaily Air temperature at sigma level 995
    units:         degK
    precision:     2
    GRIB_id:       11
    GRIB_name:     TMP
    var_desc:      Air temperature
    dataset:       NMC Reanalysis
    level_desc:    Surface
    statistic:     Individual Obs
    parent_stat:   Other
    actual_range:  [185.16 322.1 ]
xarray.DataArray
'air'
- 265.4
array(265.4, dtype=float32)
- lat()float3250.0
- standard_name :
- latitude
- long_name :
- Latitude
- units :
- degrees_north
- axis :
- Y
array(50., dtype=float32)
- lon()float32300.0
- standard_name :
- longitude
- long_name :
- Longitude
- units :
- degrees_east
- axis :
- X
array(300., dtype=float32)
- time()datetime64[ns]2013-12-01
- standard_name :
- time
- long_name :
- Time
array('2013-12-01T00:00:00.000000000', dtype='datetime64[ns]')
- long_name :
- 4xDaily Air temperature at sigma level 995
- units :
- degK
- precision :
- 2
- GRIB_id :
- 11
- GRIB_name :
- TMP
- var_desc :
- Air temperature
- dataset :
- NMC Reanalysis
- level_desc :
- Surface
- statistic :
- Individual Obs
- parent_stat :
- Other
- actual_range :
- [185.16 322.1 ]
# slice 选取坐标范围
air_temp.air.sel(lat=50,lon=300,time=slice('2013-12-01T00:00:00','2013-12-02T00:00:00'))
<xarray.DataArray 'air' (time: 5)>
array([265.4    , 267.79   , 268.19998, 269.6    , 268.79   ], dtype=float32)
Coordinates:
    lat      float32 50.0
    lon      float32 300.0
  * time     (time) datetime64[ns] 2013-12-01 2013-12-01T06:00:00 ... 2013-12-02
Attributes:
    long_name:     4xDaily Air temperature at sigma level 995
    units:         degK
    precision:     2
    GRIB_id:       11
    GRIB_name:     TMP
    var_desc:      Air temperature
    dataset:       NMC Reanalysis
    level_desc:    Surface
    statistic:     Individual Obs
    parent_stat:   Other
    actual_range:  [185.16 322.1 ]
xarray.DataArray
'air'
- time: 5
- 265.4 267.8 268.2 269.6 268.8
array([265.4 , 267.79 , 268.19998, 269.6 , 268.79 ], dtype=float32)
- lat()float3250.0
- standard_name :
- latitude
- long_name :
- Latitude
- units :
- degrees_north
- axis :
- Y
array(50., dtype=float32)
- lon()float32300.0
- standard_name :
- longitude
- long_name :
- Longitude
- units :
- degrees_east
- axis :
- X
array(300., dtype=float32)
- time(time)datetime64[ns]2013-12-01 ... 2013-12-02
- standard_name :
- time
- long_name :
- Time
array(['2013-12-01T00:00:00.000000000', '2013-12-01T06:00:00.000000000',
       '2013-12-01T12:00:00.000000000', '2013-12-01T18:00:00.000000000',
       '2013-12-02T00:00:00.000000000'], dtype='datetime64[ns]')
- long_name :
- 4xDaily Air temperature at sigma level 995
- units :
- degK
- precision :
- 2
- GRIB_id :
- 11
- GRIB_name :
- TMP
- var_desc :
- Air temperature
- dataset :
- NMC Reanalysis
- level_desc :
- Surface
- statistic :
- Individual Obs
- parent_stat :
- Other
- actual_range :
- [185.16 322.1 ]
air_temp.air.sel(lat=73,lon=300,time='2013-12-02T00:00:00',method='nearest')
<xarray.DataArray 'air' ()>
array(259.69998, dtype=float32)
Coordinates:
    lat      float32 72.5
    lon      float32 300.0
    time     datetime64[ns] 2013-12-02
Attributes:
    long_name:     4xDaily Air temperature at sigma level 995
    units:         degK
    precision:     2
    GRIB_id:       11
    GRIB_name:     TMP
    var_desc:      Air temperature
    dataset:       NMC Reanalysis
    level_desc:    Surface
    statistic:     Individual Obs
    parent_stat:   Other
    actual_range:  [185.16 322.1 ]
xarray.DataArray
'air'
- 259.7
array(259.69998, dtype=float32)
- lat()float3272.5
- standard_name :
- latitude
- long_name :
- Latitude
- units :
- degrees_north
- axis :
- Y
array(72.5, dtype=float32)
- lon()float32300.0
- standard_name :
- longitude
- long_name :
- Longitude
- units :
- degrees_east
- axis :
- X
array(300., dtype=float32)
- time()datetime64[ns]2013-12-02
- standard_name :
- time
- long_name :
- Time
array('2013-12-02T00:00:00.000000000', dtype='datetime64[ns]')
- long_name :
- 4xDaily Air temperature at sigma level 995
- units :
- degK
- precision :
- 2
- GRIB_id :
- 11
- GRIB_name :
- TMP
- var_desc :
- Air temperature
- dataset :
- NMC Reanalysis
- level_desc :
- Surface
- statistic :
- Individual Obs
- parent_stat :
- Other
- actual_range :
- [185.16 322.1 ]
method 参数的选项:
None(default): only exact matchespad/ffill: propagate last valid index value forwardbackfill/bfill: propagate next valid index value backwardnearest: use nearest valid index value
.sel 对整个数据集也可以使用, 注意数据中 lat 是倒序的
#
air_temp.sel(lat=slice(75,50),lon=300,time='2013-12-02T00:00:00')
<xarray.Dataset>
Dimensions:  (lat: 11)
Coordinates:
  * lat      (lat) float32 75.0 72.5 70.0 67.5 65.0 ... 60.0 57.5 55.0 52.5 50.0
    lon      float32 300.0
    time     datetime64[ns] 2013-12-02
Data variables:
    air      (lat) float32 253.8 259.7 254.4 253.1 ... 262.3 258.3 259.2 268.8
Attributes:
    Conventions:  COARDS
    title:        4x daily NMC reanalysis (1948)
    description:  Data is from NMC initialized reanalysis\n(4x/day).  These a...
    platform:     Model
    references:   http://www.esrl.noaa.gov/psd/data/gridded/data.ncep.reanaly...
xarray.Dataset
- lat: 11
- lat(lat)float3275.0 72.5 70.0 ... 55.0 52.5 50.0
- standard_name :
- latitude
- long_name :
- Latitude
- units :
- degrees_north
- axis :
- Y
array([75. , 72.5, 70. , 67.5, 65. , 62.5, 60. , 57.5, 55. , 52.5, 50. ], dtype=float32) - lon()float32300.0
- standard_name :
- longitude
- long_name :
- Longitude
- units :
- degrees_east
- axis :
- X
array(300., dtype=float32)
- time()datetime64[ns]2013-12-02
- standard_name :
- time
- long_name :
- Time
array('2013-12-02T00:00:00.000000000', dtype='datetime64[ns]')
- air(lat)float32253.8 259.7 254.4 ... 259.2 268.8
- long_name :
- 4xDaily Air temperature at sigma level 995
- units :
- degK
- precision :
- 2
- GRIB_id :
- 11
- GRIB_name :
- TMP
- var_desc :
- Air temperature
- dataset :
- NMC Reanalysis
- level_desc :
- Surface
- statistic :
- Individual Obs
- parent_stat :
- Other
- actual_range :
- [185.16 322.1 ]
array([253.79999, 259.69998, 254.39   , 253.09999, 259.79   , 264.79   ,
       264.6    , 262.29   , 258.29   , 259.19998, 268.79   ], dtype=float32)
- Conventions :
- COARDS
- title :
- 4x daily NMC reanalysis (1948)
- description :
- Data is from NMC initialized reanalysis (4x/day). These are the 0.9950 sigma level values.
- platform :
- Model
- references :
- http://www.esrl.noaa.gov/psd/data/gridded/data.ncep.reanalysis.html
4. 简单绘图
from pandas.plotting import register_matplotlib_converters
register_matplotlib_converters()

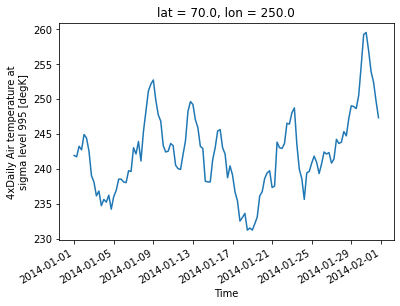
air_temp.air.sel(lat=70,lon=250,time='2014-01').plot()
[<matplotlib.lines.Line2D at 0x7fed28c773d0>]
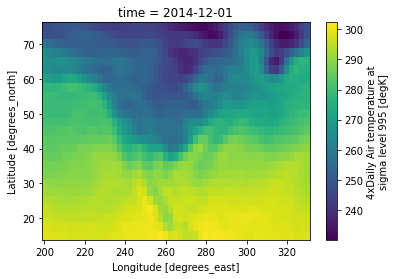
air_temp.air.sel(time='2014-12-01T00:00:00').plot()
<matplotlib.collections.QuadMesh at 0x7fed28e0e190>
5. 基本算术运算
air_temp + 20.0
<xarray.Dataset>
Dimensions:  (lat: 25, lon: 53, time: 2920)
Coordinates:
  * lat      (lat) float32 75.0 72.5 70.0 67.5 65.0 ... 25.0 22.5 20.0 17.5 15.0
  * lon      (lon) float32 200.0 202.5 205.0 207.5 ... 322.5 325.0 327.5 330.0
  * time     (time) datetime64[ns] 2013-01-01 ... 2014-12-31T18:00:00
Data variables:
    air      (time, lat, lon) float32 261.2 262.5 263.5 ... 316.5 316.2 315.7
Attributes:
    Conventions:  COARDS
    title:        4x daily NMC reanalysis (1948)
    description:  Data is from NMC initialized reanalysis\n(4x/day).  These a...
    platform:     Model
    references:   http://www.esrl.noaa.gov/psd/data/gridded/data.ncep.reanaly...
xarray.Dataset
- lat: 25
- lon: 53
- time: 2920
- lat(lat)float3275.0 72.5 70.0 ... 20.0 17.5 15.0
- standard_name :
- latitude
- long_name :
- Latitude
- units :
- degrees_north
- axis :
- Y
array([75. , 72.5, 70. , 67.5, 65. , 62.5, 60. , 57.5, 55. , 52.5, 50. , 47.5, 45. , 42.5, 40. , 37.5, 35. , 32.5, 30. , 27.5, 25. , 22.5, 20. , 17.5, 15. ], dtype=float32) - lon(lon)float32200.0 202.5 205.0 ... 327.5 330.0
- standard_name :
- longitude
- long_name :
- Longitude
- units :
- degrees_east
- axis :
- X
array([200. , 202.5, 205. , 207.5, 210. , 212.5, 215. , 217.5, 220. , 222.5, 225. , 227.5, 230. , 232.5, 235. , 237.5, 240. , 242.5, 245. , 247.5, 250. , 252.5, 255. , 257.5, 260. , 262.5, 265. , 267.5, 270. , 272.5, 275. , 277.5, 280. , 282.5, 285. , 287.5, 290. , 292.5, 295. , 297.5, 300. , 302.5, 305. , 307.5, 310. , 312.5, 315. , 317.5, 320. , 322.5, 325. , 327.5, 330. ], dtype=float32) - time(time)datetime64[ns]2013-01-01 ... 2014-12-31T18:00:00
- standard_name :
- time
- long_name :
- Time
array(['2013-01-01T00:00:00.000000000', '2013-01-01T06:00:00.000000000',
       '2013-01-01T12:00:00.000000000', ..., '2014-12-31T06:00:00.000000000',
       '2014-12-31T12:00:00.000000000', '2014-12-31T18:00:00.000000000'],
      dtype='datetime64[ns]')
- air(time, lat, lon)float32261.2 262.5 263.5 ... 316.2 315.7
array([[[261.2    , 262.5    , 263.5    , ..., 252.79999, 255.5    ,
         258.59998],
        [263.8    , 264.5    , 264.7    , ..., 252.79999, 255.29999,
         259.3    ],
        [270.     , 269.8    , 268.89   , ..., 253.2    , 256.39   ,
         261.7    ],
        ...,
        [316.6    , 316.19998, 316.4    , ..., 315.4    , 315.1    ,
         314.69998],
        [315.9    , 316.19998, 316.79   , ..., 315.9    , 315.9    ,
         315.19998],
        [316.29   , 316.79   , 317.1    , ..., 316.9    , 316.79   ,
         316.6    ]],

       [[262.09998, 262.7    , 263.09998, ..., 252.     , 253.59999,
         255.79999],
        [263.59998, 264.09998, 264.2    , ..., 251.     , 252.5    ,
         255.7    ],
        [273.2    , 272.89   , 272.09998, ..., 250.79999, 253.39   ,
         258.5    ],
...
        [313.69   , 313.88998, 315.38998, ..., 315.09   , 314.69   ,
         314.29   ],
        [316.29   , 317.19   , 317.59   , ..., 315.29   , 315.09   ,
         314.38998],
        [317.79   , 318.38998, 318.49   , ..., 315.69   , 315.49   ,
         315.19   ]],

       [[265.09   , 264.28998, 263.28998, ..., 261.69   , 261.49   ,
         261.78998],
        [269.89   , 269.28998, 268.39   , ..., 259.59   , 260.28998,
         261.69   ],
        [282.99   , 282.19   , 281.38998, ..., 259.89   , 262.59   ,
         266.28998],
        ...,
        [313.79   , 313.69   , 315.09   , ..., 315.29   , 315.09   ,
         314.69   ],
        [316.09   , 316.88998, 317.19   , ..., 315.69   , 315.69   ,
         315.19   ],
        [317.69   , 318.09   , 318.09   , ..., 316.49   , 316.19   ,
         315.69   ]]], dtype=float32)
- Conventions :
- COARDS
- title :
- 4x daily NMC reanalysis (1948)
- description :
- Data is from NMC initialized reanalysis (4x/day). These are the 0.9950 sigma level values.
- platform :
- Model
- references :
- http://www.esrl.noaa.gov/psd/data/gridded/data.ncep.reanalysis.html
air_temp * 1.1
<xarray.Dataset>
Dimensions:  (lat: 25, lon: 53, time: 2920)
Coordinates:
  * lat      (lat) float32 75.0 72.5 70.0 67.5 65.0 ... 25.0 22.5 20.0 17.5 15.0
  * lon      (lon) float32 200.0 202.5 205.0 207.5 ... 322.5 325.0 327.5 330.0
  * time     (time) datetime64[ns] 2013-01-01 ... 2014-12-31T18:00:00
Data variables:
    air      (time, lat, lon) float32 265.3 266.8 267.9 ... 326.1 325.8 325.3
Attributes:
    Conventions:  COARDS
    title:        4x daily NMC reanalysis (1948)
    description:  Data is from NMC initialized reanalysis\n(4x/day).  These a...
    platform:     Model
    references:   http://www.esrl.noaa.gov/psd/data/gridded/data.ncep.reanaly...
xarray.Dataset
- lat: 25
- lon: 53
- time: 2920
- lat(lat)float3275.0 72.5 70.0 ... 20.0 17.5 15.0
- standard_name :
- latitude
- long_name :
- Latitude
- units :
- degrees_north
- axis :
- Y
array([75. , 72.5, 70. , 67.5, 65. , 62.5, 60. , 57.5, 55. , 52.5, 50. , 47.5, 45. , 42.5, 40. , 37.5, 35. , 32.5, 30. , 27.5, 25. , 22.5, 20. , 17.5, 15. ], dtype=float32) - lon(lon)float32200.0 202.5 205.0 ... 327.5 330.0
- standard_name :
- longitude
- long_name :
- Longitude
- units :
- degrees_east
- axis :
- X
array([200. , 202.5, 205. , 207.5, 210. , 212.5, 215. , 217.5, 220. , 222.5, 225. , 227.5, 230. , 232.5, 235. , 237.5, 240. , 242.5, 245. , 247.5, 250. , 252.5, 255. , 257.5, 260. , 262.5, 265. , 267.5, 270. , 272.5, 275. , 277.5, 280. , 282.5, 285. , 287.5, 290. , 292.5, 295. , 297.5, 300. , 302.5, 305. , 307.5, 310. , 312.5, 315. , 317.5, 320. , 322.5, 325. , 327.5, 330. ], dtype=float32) - time(time)datetime64[ns]2013-01-01 ... 2014-12-31T18:00:00
- standard_name :
- time
- long_name :
- Time
array(['2013-01-01T00:00:00.000000000', '2013-01-01T06:00:00.000000000',
       '2013-01-01T12:00:00.000000000', ..., '2014-12-31T06:00:00.000000000',
       '2014-12-31T12:00:00.000000000', '2014-12-31T18:00:00.000000000'],
      dtype='datetime64[ns]')
- air(time, lat, lon)float32265.3 266.8 267.9 ... 325.8 325.3
array([[[265.32   , 266.75   , 267.85   , ..., 256.08   , 259.05002,
         262.46   ],
        [268.18   , 268.95   , 269.17   , ..., 256.08   , 258.83   ,
         263.22998],
        [275.     , 274.78   , 273.779  , ..., 256.52   , 260.029  ,
         265.87   ],
        ...,
        [326.26   , 325.81998, 326.04   , ..., 324.94   , 324.61002,
         324.16998],
        [325.49   , 325.81998, 326.46902, ..., 325.49   , 325.49   ,
         324.72   ],
        [325.919  , 326.46902, 326.81003, ..., 326.59   , 326.46902,
         326.26   ]],

       [[266.31   , 266.97   , 267.41   , ..., 255.20001, 256.96   ,
         259.38   ],
        [267.96   , 268.51   , 268.62   , ..., 254.1    , 255.75   ,
         259.27   ],
        [278.52   , 278.17902, 277.31   , ..., 253.87999, 256.729  ,
         262.35   ],
...
        [323.05902, 323.279  , 324.929  , ..., 324.599  , 324.159  ,
         323.71902],
        [325.919  , 326.909  , 327.349  , ..., 324.81903, 324.599  ,
         323.82898],
        [327.56903, 328.229  , 328.339  , ..., 325.259  , 325.039  ,
         324.709  ]],

       [[269.599  , 268.719  , 267.619  , ..., 265.85898, 265.639  ,
         265.969  ],
        [274.879  , 274.219  , 273.229  , ..., 263.549  , 264.319  ,
         265.85898],
        [289.289  , 288.409  , 287.529  , ..., 263.879  , 266.849  ,
         270.919  ],
        ...,
        [323.169  , 323.05902, 324.599  , ..., 324.81903, 324.599  ,
         324.159  ],
        [325.699  , 326.57898, 326.909  , ..., 325.259  , 325.259  ,
         324.709  ],
        [327.459  , 327.89902, 327.89902, ..., 326.139  , 325.80902,
         325.259  ]]], dtype=float32)
- Conventions :
- COARDS
- title :
- 4x daily NMC reanalysis (1948)
- description :
- Data is from NMC initialized reanalysis (4x/day). These are the 0.9950 sigma level values.
- platform :
- Model
- references :
- http://www.esrl.noaa.gov/psd/data/gridded/data.ncep.reanalysis.html
np.sin(air_temp)
<xarray.Dataset>
Dimensions:  (lat: 25, lon: 53, time: 2920)
Coordinates:
  * lat      (lat) float32 75.0 72.5 70.0 67.5 65.0 ... 25.0 22.5 20.0 17.5 15.0
  * lon      (lon) float32 200.0 202.5 205.0 207.5 ... 322.5 325.0 327.5 330.0
  * time     (time) datetime64[ns] 2013-01-01 ... 2014-12-31T18:00:00
Data variables:
    air      (time, lat, lon) float32 0.6462 -0.5625 -0.9996 ... 0.7709 0.3712
Attributes:
    Conventions:  COARDS
    title:        4x daily NMC reanalysis (1948)
    description:  Data is from NMC initialized reanalysis\n(4x/day).  These a...
    platform:     Model
    references:   http://www.esrl.noaa.gov/psd/data/gridded/data.ncep.reanaly...
xarray.Dataset
- lat: 25
- lon: 53
- time: 2920
- lat(lat)float3275.0 72.5 70.0 ... 20.0 17.5 15.0
- standard_name :
- latitude
- long_name :
- Latitude
- units :
- degrees_north
- axis :
- Y
array([75. , 72.5, 70. , 67.5, 65. , 62.5, 60. , 57.5, 55. , 52.5, 50. , 47.5, 45. , 42.5, 40. , 37.5, 35. , 32.5, 30. , 27.5, 25. , 22.5, 20. , 17.5, 15. ], dtype=float32) - lon(lon)float32200.0 202.5 205.0 ... 327.5 330.0
- standard_name :
- longitude
- long_name :
- Longitude
- units :
- degrees_east
- axis :
- X
array([200. , 202.5, 205. , 207.5, 210. , 212.5, 215. , 217.5, 220. , 222.5, 225. , 227.5, 230. , 232.5, 235. , 237.5, 240. , 242.5, 245. , 247.5, 250. , 252.5, 255. , 257.5, 260. , 262.5, 265. , 267.5, 270. , 272.5, 275. , 277.5, 280. , 282.5, 285. , 287.5, 290. , 292.5, 295. , 297.5, 300. , 302.5, 305. , 307.5, 310. , 312.5, 315. , 317.5, 320. , 322.5, 325. , 327.5, 330. ], dtype=float32) - time(time)datetime64[ns]2013-01-01 ... 2014-12-31T18:00:00
- standard_name :
- time
- long_name :
- Time
array(['2013-01-01T00:00:00.000000000', '2013-01-01T06:00:00.000000000',
       '2013-01-01T12:00:00.000000000', ..., '2014-12-31T06:00:00.000000000',
       '2014-12-31T12:00:00.000000000', '2014-12-31T18:00:00.000000000'],
      dtype='datetime64[ns]')
- air(time, lat, lon)float320.6462 -0.5625 ... 0.7709 0.3712
- long_name :
- 4xDaily Air temperature at sigma level 995
- units :
- degK
- precision :
- 2
- GRIB_id :
- 11
- GRIB_name :
- TMP
- var_desc :
- Air temperature
- dataset :
- NMC Reanalysis
- level_desc :
- Surface
- statistic :
- Individual Obs
- parent_stat :
- Other
- actual_range :
- [185.16 322.1 ]
array([[[ 0.6462326 , -0.5624663 , -0.9996471 , ...,  0.31658906,
          0.11916517, -0.16035552],
        [-0.9471524 , -0.51775694, -0.33747196, ...,  0.31658906,
          0.3140551 ,  0.51323175],
        [-0.970528  , -0.9990596 , -0.6474089 , ...,  0.6609925 ,
         -0.6965303 ,  0.20125344],
        ...,
        [ 0.96091723,  0.7772431 ,  0.88675845, ...,  0.09016185,
         -0.20816974, -0.5726443 ],
        [ 0.55659735,  0.7772431 ,  0.9959079 , ...,  0.55659735,
          0.55659735, -0.10950769],
        [ 0.830664  ,  0.9959079 ,  0.9760064 , ...,  0.9998101 ,
          0.9959079 ,  0.96091723]],

       [[-0.19607785, -0.71551615, -0.93107796, ..., -0.45987672,
          0.90102834, -0.17955962],
        [-0.99200195, -0.81004924, -0.7474598 , ..., -0.9956842 ,
          0.02214182, -0.08046086],
        [ 0.95480645,  0.9999663 ,  0.6979841 , ..., -0.99427325,
          0.7908172 , -0.25808707],
...
        [-0.9988041 , -0.98861045,  0.08018851, ..., -0.21794963,
         -0.58079666, -0.8519514 ],
        [ 0.830664  ,  0.952487  ,  0.7586938 , ..., -0.01969962,
         -0.21794963, -0.7954352 ],
        [ 0.61413825,  0.06127954, -0.03867849, ...,  0.37119257,
          0.17930582, -0.1194213 ]],

       [[ 0.04575338, -0.6847304 , -0.9832225 , ...,  0.21104816,
          0.4010329 ,  0.112403  ],
        [-0.9911176 , -0.89309275, -0.20276402, ...,  0.7372255 ,
          0.99912465,  0.21104816],
        [-0.78567886, -0.99117064, -0.5954245 , ...,  0.90396696,
         -0.63450044,  0.94764113],
        ...,
        [-0.9986949 , -0.9988041 , -0.21794963, ..., -0.01969962,
         -0.21794963, -0.58079666],
        [ 0.70348334,  0.99995506,  0.952487  , ...,  0.37119257,
          0.37119257, -0.1194213 ],
        [ 0.6898629 ,  0.353496  ,  0.353496  , ...,  0.92471296,
          0.7709256 ,  0.37119257]]], dtype=float32)
- Conventions :
- COARDS
- title :
- 4x daily NMC reanalysis (1948)
- description :
- Data is from NMC initialized reanalysis (4x/day). These are the 0.9950 sigma level values.
- platform :
- Model
- references :
- http://www.esrl.noaa.gov/psd/data/gridded/data.ncep.reanalysis.html
6. 聚合运算
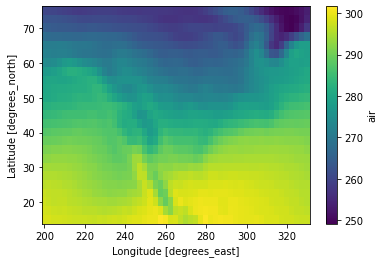
air_temp.air.mean(dim='time').plot()
<matplotlib.collections.QuadMesh at 0x7fed28f57d90>
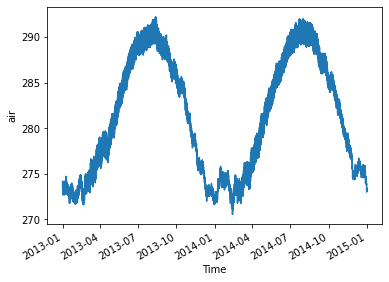
air_temp.air.mean(dim=['lat','lon']).plot()
[<matplotlib.lines.Line2D at 0x7fed0dfca690>]
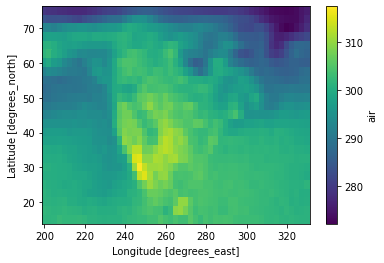
air_temp.air.max(dim='time').plot()
<matplotlib.collections.QuadMesh at 0x7fed11b440d0>
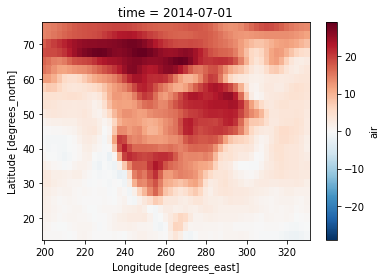
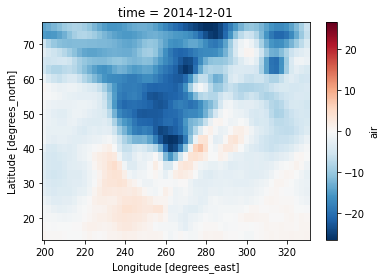
anomaly = air_temp.air - air_temp.air.mean(dim='time')
anomaly.sel(time='2014-07-01T00:00:00').plot()
<matplotlib.collections.QuadMesh at 0x7fed11cf6bd0>
anomaly.sel(time='2014-12-01T00:00:00').plot()
<matplotlib.collections.QuadMesh at 0x7fed11ea3950>
anomaly
<xarray.DataArray 'air' (time: 2920, lat: 25, lon: 53)>
array([[[-1.91756439e+01, -1.76825867e+01, -1.63859253e+01, ...,
         -1.80151215e+01, -1.64373322e+01, -1.48374176e+01],
        [-1.89337158e+01, -1.82936096e+01, -1.80489044e+01, ...,
         -1.69549713e+01, -1.62852173e+01, -1.50585022e+01],
        [-1.47680969e+01, -1.45270996e+01, -1.51714020e+01, ...,
         -1.74070740e+01, -1.71924744e+01, -1.60147552e+01],
        ...,
        [-1.04931641e+00, -7.52960205e-01, -2.29125977e-01, ...,
         -1.41033936e+00, -1.18792725e+00, -1.11624146e+00],
        [-2.22869873e+00, -1.73648071e+00, -6.80053711e-01, ...,
         -9.59106445e-01, -8.76861572e-01, -1.24349976e+00],
        [-2.07592773e+00, -1.59591675e+00, -1.01385498e+00, ...,
         -4.37774658e-01, -4.91027832e-01, -7.05017090e-01]],

       [[-1.82756500e+01, -1.74825897e+01, -1.67859344e+01, ...,
         -1.88151093e+01, -1.83373413e+01, -1.76374207e+01],
        [-1.91337128e+01, -1.86936188e+01, -1.85489044e+01, ...,
         -1.87549591e+01, -1.90852051e+01, -1.86584930e+01],
        [-1.15681000e+01, -1.14370880e+01, -1.19614105e+01, ...,
         -1.98070831e+01, -2.01924744e+01, -1.92147522e+01],
...
         -1.72033691e+00, -1.59793091e+00, -1.52621460e+00],
        [-1.83868408e+00, -7.46459961e-01,  1.19934082e-01, ...,
         -1.56909180e+00, -1.68685913e+00, -2.05349731e+00],
        [-5.75927734e-01,  4.05883789e-03,  3.76129150e-01, ...,
         -1.64776611e+00, -1.79104614e+00, -2.11502075e+00]],

       [[-1.52856445e+01, -1.58925934e+01, -1.65959320e+01, ...,
         -9.12512207e+00, -1.04473419e+01, -1.16474152e+01],
        [-1.28437042e+01, -1.35036163e+01, -1.43589020e+01, ...,
         -1.01649628e+01, -1.12952118e+01, -1.26685028e+01],
        [-1.77810669e+00, -2.13708496e+00, -2.67141724e+00, ...,
         -1.07170715e+01, -1.09924774e+01, -1.14247589e+01],
        ...,
        [-3.85931396e+00, -3.26293945e+00, -1.53912354e+00, ...,
         -1.52032471e+00, -1.19793701e+00, -1.12622070e+00],
        [-2.03869629e+00, -1.04647827e+00, -2.80059814e-01, ...,
         -1.16909790e+00, -1.08685303e+00, -1.25347900e+00],
        [-6.75933838e-01, -2.95928955e-01, -2.38647461e-02, ...,
         -8.47778320e-01, -1.09103394e+00, -1.61502075e+00]]],
      dtype=float32)
Coordinates:
  * lat      (lat) float32 75.0 72.5 70.0 67.5 65.0 ... 25.0 22.5 20.0 17.5 15.0
  * lon      (lon) float32 200.0 202.5 205.0 207.5 ... 322.5 325.0 327.5 330.0
  * time     (time) datetime64[ns] 2013-01-01 ... 2014-12-31T18:00:00
xarray.DataArray
'air'
- time: 2920
- lat: 25
- lon: 53
- -19.18 -17.68 -16.39 -15.48 -14.92 ... -0.6273 -0.8478 -1.091 -1.615
array([[[-1.91756439e+01, -1.76825867e+01, -1.63859253e+01, ..., -1.80151215e+01, -1.64373322e+01, -1.48374176e+01], [-1.89337158e+01, -1.82936096e+01, -1.80489044e+01, ..., -1.69549713e+01, -1.62852173e+01, -1.50585022e+01], [-1.47680969e+01, -1.45270996e+01, -1.51714020e+01, ..., -1.74070740e+01, -1.71924744e+01, -1.60147552e+01], ..., [-1.04931641e+00, -7.52960205e-01, -2.29125977e-01, ..., -1.41033936e+00, -1.18792725e+00, -1.11624146e+00], [-2.22869873e+00, -1.73648071e+00, -6.80053711e-01, ..., -9.59106445e-01, -8.76861572e-01, -1.24349976e+00], [-2.07592773e+00, -1.59591675e+00, -1.01385498e+00, ..., -4.37774658e-01, -4.91027832e-01, -7.05017090e-01]], [[-1.82756500e+01, -1.74825897e+01, -1.67859344e+01, ..., -1.88151093e+01, -1.83373413e+01, -1.76374207e+01], [-1.91337128e+01, -1.86936188e+01, -1.85489044e+01, ..., -1.87549591e+01, -1.90852051e+01, -1.86584930e+01], [-1.15681000e+01, -1.14370880e+01, -1.19614105e+01, ..., -1.98070831e+01, -2.01924744e+01, -1.92147522e+01], ... -1.72033691e+00, -1.59793091e+00, -1.52621460e+00], [-1.83868408e+00, -7.46459961e-01, 1.19934082e-01, ..., -1.56909180e+00, -1.68685913e+00, -2.05349731e+00], [-5.75927734e-01, 4.05883789e-03, 3.76129150e-01, ..., -1.64776611e+00, -1.79104614e+00, -2.11502075e+00]], [[-1.52856445e+01, -1.58925934e+01, -1.65959320e+01, ..., -9.12512207e+00, -1.04473419e+01, -1.16474152e+01], [-1.28437042e+01, -1.35036163e+01, -1.43589020e+01, ..., -1.01649628e+01, -1.12952118e+01, -1.26685028e+01], [-1.77810669e+00, -2.13708496e+00, -2.67141724e+00, ..., -1.07170715e+01, -1.09924774e+01, -1.14247589e+01], ..., [-3.85931396e+00, -3.26293945e+00, -1.53912354e+00, ..., -1.52032471e+00, -1.19793701e+00, -1.12622070e+00], [-2.03869629e+00, -1.04647827e+00, -2.80059814e-01, ..., -1.16909790e+00, -1.08685303e+00, -1.25347900e+00], [-6.75933838e-01, -2.95928955e-01, -2.38647461e-02, ..., -8.47778320e-01, -1.09103394e+00, -1.61502075e+00]]], dtype=float32) - lat(lat)float3275.0 72.5 70.0 ... 20.0 17.5 15.0
- standard_name :
- latitude
- long_name :
- Latitude
- units :
- degrees_north
- axis :
- Y
array([75. , 72.5, 70. , 67.5, 65. , 62.5, 60. , 57.5, 55. , 52.5, 50. , 47.5, 45. , 42.5, 40. , 37.5, 35. , 32.5, 30. , 27.5, 25. , 22.5, 20. , 17.5, 15. ], dtype=float32) - lon(lon)float32200.0 202.5 205.0 ... 327.5 330.0
- standard_name :
- longitude
- long_name :
- Longitude
- units :
- degrees_east
- axis :
- X
array([200. , 202.5, 205. , 207.5, 210. , 212.5, 215. , 217.5, 220. , 222.5, 225. , 227.5, 230. , 232.5, 235. , 237.5, 240. , 242.5, 245. , 247.5, 250. , 252.5, 255. , 257.5, 260. , 262.5, 265. , 267.5, 270. , 272.5, 275. , 277.5, 280. , 282.5, 285. , 287.5, 290. , 292.5, 295. , 297.5, 300. , 302.5, 305. , 307.5, 310. , 312.5, 315. , 317.5, 320. , 322.5, 325. , 327.5, 330. ], dtype=float32) - time(time)datetime64[ns]2013-01-01 ... 2014-12-31T18:00:00
- standard_name :
- time
- long_name :
- Time
array(['2013-01-01T00:00:00.000000000', '2013-01-01T06:00:00.000000000',
       '2013-01-01T12:00:00.000000000', ..., '2014-12-31T06:00:00.000000000',
       '2014-12-31T12:00:00.000000000', '2014-12-31T18:00:00.000000000'],
      dtype='datetime64[ns]')
