大气数据处理及可视化
Contents
大气数据处理及可视化
知识点:大气(包括海洋)数据读取、处理及可视化,包括模式结果处理
工具:xarray, wrf-python, pandas, cartopy, regionmask
全球平均气温
我们使用以前课上用过的 NCEP 再分析资料 air.mon.mean.nc 来计算全球平均气温 (1948-2016)
import xarray as xr
import numpy as np
xr.set_options(display_style="text")
<xarray.core.options.set_options at 0x7fc0bc960b10>
mon_air = xr.open_dataarray('air.mon.mean.nc')
mon_air
<xarray.DataArray 'air' (time: 832, lat: 73, lon: 144)>
[8745984 values with dtype=float32]
Coordinates:
  * lat      (lat) float32 90.0 87.5 85.0 82.5 80.0 ... -82.5 -85.0 -87.5 -90.0
  * lon      (lon) float32 0.0 2.5 5.0 7.5 10.0 ... 350.0 352.5 355.0 357.5
  * time     (time) datetime64[ns] 1948-01-01 1948-02-01 ... 2017-04-01
Attributes:
    long_name:     Monthly Mean Air Temperature at sigma level 0.995
    valid_range:   [-2000.  2000.]
    units:         degC
    precision:     1
    var_desc:      Air Temperature
    level_desc:    Surface
    statistic:     Mean
    parent_stat:   Individual Obs
    dataset:       NCEP Reanalysis Derived Products
    actual_range:  [-73.78001  41.74902]
mon_air_2016 = mon_air.sel(time='2016')
mon_air_2016
<xarray.DataArray 'air' (time: 12, lat: 73, lon: 144)>
[126144 values with dtype=float32]
Coordinates:
  * lat      (lat) float32 90.0 87.5 85.0 82.5 80.0 ... -82.5 -85.0 -87.5 -90.0
  * lon      (lon) float32 0.0 2.5 5.0 7.5 10.0 ... 350.0 352.5 355.0 357.5
  * time     (time) datetime64[ns] 2016-01-01 2016-02-01 ... 2016-12-01
Attributes:
    long_name:     Monthly Mean Air Temperature at sigma level 0.995
    valid_range:   [-2000.  2000.]
    units:         degC
    precision:     1
    var_desc:      Air Temperature
    level_desc:    Surface
    statistic:     Mean
    parent_stat:   Individual Obs
    dataset:       NCEP Reanalysis Derived Products
actual_range: [-73.78001 41.74902]mon_air_2016.mean()
<xarray.DataArray 'air' ()>
array(5.7122564, dtype=float32)
这个结果合理吗?
每个月长度不同
参考 http://xarray.pydata.org/en/stable/examples/monthly-means.html
更重要的是,地球是个球体,各处的面积并不相同
在地球经度 \(\varphi\) 和纬度 \(\lambda\) 处,地球表面微元面积为
所以在纬度 \([\lambda, \lambda+d\lambda]\) 之间,地球表面面积 \(dA\propto\cos\lambda\)。
我们忽略每月天数的不同,只考虑地球表面积的影响
建立一个纬度余弦值构成的权重数组,并归一化(权重之和为1)
先对经度求平均,再用权重对纬度求平均,最后对时间求平均;或者先对经度和时间求平均,再用权重对纬度求平均
mon_air_2016_zonal = mon_air_2016.mean(dim='lon')
weight = np.cos(np.deg2rad(mon_air_2016.lat))
weight
<xarray.DataArray 'lat' (lat: 73)>
array([-4.3711388e-08,  4.3619454e-02,  8.7155797e-02,  1.3052624e-01,
        1.7364822e-01,  2.1643965e-01,  2.5881907e-01,  3.0070582e-01,
        3.4202015e-01,  3.8268346e-01,  4.2261827e-01,  4.6174860e-01,
        4.9999997e-01,  5.3729957e-01,  5.7357645e-01,  6.0876143e-01,
        6.4278758e-01,  6.7559016e-01,  7.0710677e-01,  7.3727733e-01,
        7.6604444e-01,  7.9335332e-01,  8.1915206e-01,  8.4339142e-01,
        8.6602539e-01,  8.8701081e-01,  9.0630776e-01,  9.2387950e-01,
        9.3969262e-01,  9.5371693e-01,  9.6592581e-01,  9.7629601e-01,
        9.8480773e-01,  9.9144489e-01,  9.9619472e-01,  9.9904823e-01,
        1.0000000e+00,  9.9904823e-01,  9.9619472e-01,  9.9144489e-01,
        9.8480773e-01,  9.7629601e-01,  9.6592581e-01,  9.5371693e-01,
        9.3969262e-01,  9.2387950e-01,  9.0630776e-01,  8.8701081e-01,
        8.6602539e-01,  8.4339142e-01,  8.1915206e-01,  7.9335332e-01,
        7.6604444e-01,  7.3727733e-01,  7.0710677e-01,  6.7559016e-01,
        6.4278758e-01,  6.0876143e-01,  5.7357645e-01,  5.3729957e-01,
        4.9999997e-01,  4.6174860e-01,  4.2261827e-01,  3.8268346e-01,
        3.4202015e-01,  3.0070582e-01,  2.5881907e-01,  2.1643965e-01,
        1.7364822e-01,  1.3052624e-01,  8.7155797e-02,  4.3619454e-02,
       -4.3711388e-08], dtype=float32)
Coordinates:
  * lat      (lat) float32 90.0 87.5 85.0 82.5 80.0 ... -82.5 -85.0 -87.5 -90.0
Attributes:
    units:          degrees_north
    actual_range:   [ 90. -90.]
    long_name:      Latitude
    standard_name:  latitude
    axis:           Y
mon_air_2016_mean = (mon_air_2016_zonal.weighted(weight)).mean(dim='lat')
注意:此处用到了 xarray 的广播功能
mon_air_2016_mean.mean().values
array(14.723972, dtype=float32)
这个结果就合理了。
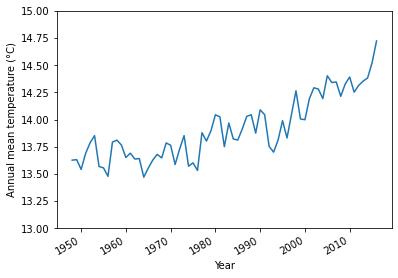
接下来,我们计算 1948-2016 年的年平均气温
mon_air = mon_air.sel(time=slice('1948','2016'))
annual_mean_temp = (mon_air.mean(dim='lon').resample(time='AS')
                    .mean(dim='time').weighted(weight)).mean(dim='lat')
annual_mean_temp
<xarray.DataArray (time: 69)>
array([13.627374 , 13.63256  , 13.542421 , 13.688788 , 13.786775 ,
       13.852996 , 13.569222 , 13.556584 , 13.479174 , 13.794247 ,
       13.811653 , 13.766874 , 13.652037 , 13.691757 , 13.637964 ,
       13.642024 , 13.4713545, 13.554589 , 13.627971 , 13.68065  ,
       13.647916 , 13.786194 , 13.764481 , 13.587351 , 13.728676 ,
       13.853309 , 13.572137 , 13.602747 , 13.5329075, 13.880501 ,
       13.803485 , 13.897291 , 14.044812 , 14.026324 , 13.751034 ,
       13.96955  , 13.822173 , 13.812693 , 13.914178 , 14.030236 ,
       14.045397 , 13.876189 , 14.090269 , 14.04588  , 13.754866 ,
       13.700959 , 13.811932 , 13.991104 , 13.831577 , 14.049007 ,
       14.265602 , 14.006957 , 13.999394 , 14.193729 , 14.293406 ,
       14.2818575, 14.193888 , 14.404059 , 14.341925 , 14.346483 ,
       14.214868 , 14.327676 , 14.3926325, 14.252834 , 14.3145895,
       14.354452 , 14.383326 , 14.522596 , 14.723971 ], dtype=float32)
Coordinates:
  * time     (time) datetime64[ns] 1948-01-01 1949-01-01 ... 2016-01-01
import matplotlib.pyplot as plt
%matplotlib inline
fig,ax=plt.subplots()
annual_mean_temp.plot(ax=ax)
ax.set_xlabel('Year')
ax.set_ylim([13,15])
ax.set_ylabel('Annual mean temperature ('+u'\u00B0'+'C)') # 度的 unicode
Text(0, 0.5, 'Annual mean temperature (°C)')
fig,ax=plt.subplots()
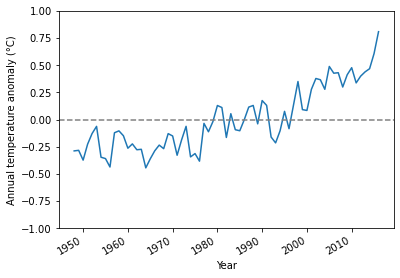
anomaly = annual_mean_temp - annual_mean_temp.mean()
anomaly.plot(ax=ax)
ax.axhline(0,linestyle='--',color='grey')
ax.set_xlabel('Year')
ax.set_ylim([-1,1])
ax.set_ylabel('Annual temperature anomaly ('+u'\u00B0'+'C)')  # 度的 unicode
Text(0, 0.5, 'Annual temperature anomaly (°C)')
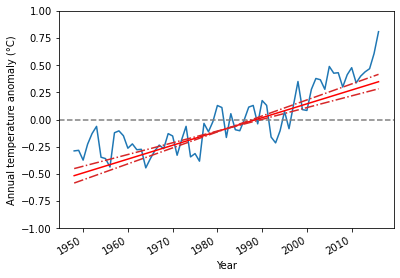
我们使用 Theil-Sen 方法来计算气温的趋势。
Theil-Sen 是一种基于秩(rank)的非参数化(non-parametric)的统计方法,对数据的分布不做任何假设,对 outlier 有很强的稳定性
from scipy import stats

t = anomaly.time.dt.year.values
X = t - t.mean()

slope, y0, beta_lr, beta_up = stats.mstats.theilslopes(anomaly.values, X,
                                                       alpha=0.95)

print('Mean value = ', y0)
print('Trend = ', slope)
print('95% confidence interval:', '[', beta_lr, ',', beta_up, ']')
Mean value =  -0.0830078125
Trend =  0.012706676166727795
95% confidence interval: [ 0.010791723544781025 , 0.014703750610351562 ]
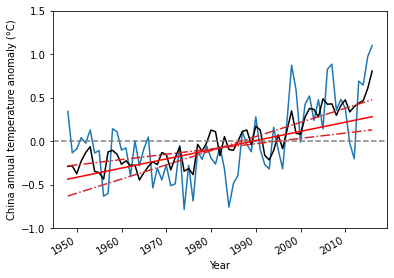
可见,1948 - 2016 年间,全球平均气温增加幅度为 0.013 \(^o\)C/年,或者 0.13 \(^o\)C/10年。
我们可以将趋势直线和对应 95% 置信区间的两条趋势直线加到上图中。
fig,ax=plt.subplots()
anomaly = annual_mean_temp - annual_mean_temp.mean()
anomaly.plot(ax=ax)
ax.axhline(0,linestyle='--',color='grey')
ax.set_xlabel('Year')
ax.set_ylim([-1,1])
ax.set_ylabel('Annual temperature anomaly ('+u'\u00B0'+'C)')  # 度的 unicode

ax.plot(anomaly.time, y0+slope*(t-t.mean()),color='r')
ax.plot(anomaly.time, y0+beta_lr*(t-t.mean()),color='tab:red',linestyle='-.')
ax.plot(anomaly.time, y0+beta_up*(t-t.mean()),color='tab:red',linestyle='-.')
[<matplotlib.lines.Line2D at 0x7fc0ab6204d0>]
中国区域的平均气温
如果我们需要用上面的数据集,求中国的平均气温,该怎么办?
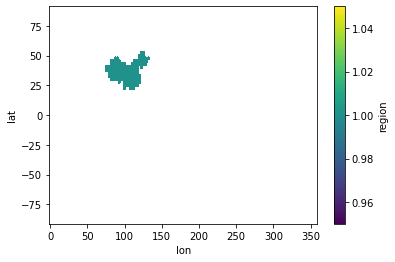
我们需要单独提取出中国区域的气温,将其它区域屏蔽掉
regionmask包提供这样的功能我们利用
simplified_china_country.shp文件来提取中国区域的气温。由于该 shapefile 不包括海洋,所以我们只计算中国陆地上的平均气温
import regionmask
import geopandas as gpd

china_shp = gpd.read_file('../shp_file/simplied_china_country.shp',encoding='utf8')
china_mask_poly = regionmask.Regions(china_shp.geometry,names='china')

china_mask = china_mask_poly.mask(mon_air)
#china_mask= np.ma.masked_invalid(china_mask)
china_mask = xr.where(china_mask==0,1.0,china_mask)
china_mask.plot()
<matplotlib.collections.QuadMesh at 0x7fc0ac06d950>
china_temp = mon_air*china_mask
china_temp
<xarray.DataArray (time: 828, lat: 73, lon: 144)>
array([[[nan, nan, nan, ..., nan, nan, nan],
        [nan, nan, nan, ..., nan, nan, nan],
        [nan, nan, nan, ..., nan, nan, nan],
        ...,
        [nan, nan, nan, ..., nan, nan, nan],
        [nan, nan, nan, ..., nan, nan, nan],
        [nan, nan, nan, ..., nan, nan, nan]],

       [[nan, nan, nan, ..., nan, nan, nan],
        [nan, nan, nan, ..., nan, nan, nan],
        [nan, nan, nan, ..., nan, nan, nan],
        ...,
        [nan, nan, nan, ..., nan, nan, nan],
        [nan, nan, nan, ..., nan, nan, nan],
        [nan, nan, nan, ..., nan, nan, nan]],

       [[nan, nan, nan, ..., nan, nan, nan],
        [nan, nan, nan, ..., nan, nan, nan],
        [nan, nan, nan, ..., nan, nan, nan],
        ...,
...
        ...,
        [nan, nan, nan, ..., nan, nan, nan],
        [nan, nan, nan, ..., nan, nan, nan],
        [nan, nan, nan, ..., nan, nan, nan]],

       [[nan, nan, nan, ..., nan, nan, nan],
        [nan, nan, nan, ..., nan, nan, nan],
        [nan, nan, nan, ..., nan, nan, nan],
        ...,
        [nan, nan, nan, ..., nan, nan, nan],
        [nan, nan, nan, ..., nan, nan, nan],
        [nan, nan, nan, ..., nan, nan, nan]],

       [[nan, nan, nan, ..., nan, nan, nan],
        [nan, nan, nan, ..., nan, nan, nan],
        [nan, nan, nan, ..., nan, nan, nan],
        ...,
        [nan, nan, nan, ..., nan, nan, nan],
        [nan, nan, nan, ..., nan, nan, nan],
        [nan, nan, nan, ..., nan, nan, nan]]])
Coordinates:
  * lat      (lat) float32 90.0 87.5 85.0 82.5 80.0 ... -82.5 -85.0 -87.5 -90.0
  * lon      (lon) float32 0.0 2.5 5.0 7.5 10.0 ... 350.0 352.5 355.0 357.5
  * time     (time) datetime64[ns] 1948-01-01 1948-02-01 ... 2016-12-01
annual_china_mean_temp = china_temp.resample(time='AS').mean(dim='time')
china_weight = xr.DataArray(np.tile(np.cos(np.deg2rad(annual_china_mean_temp.lat)).values,
(len(annual_china_mean_temp.lon),1)).T,
dims=['lat','lon'],
coords={'lon':annual_china_mean_temp.lon,'lat':annual_china_mean_temp.lat})
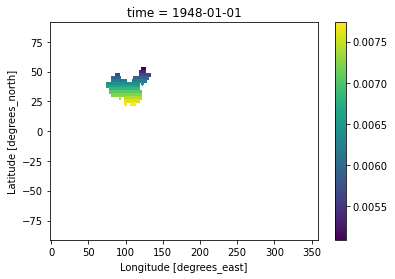
china_weight = china_weight.where(~np.isnan(annual_china_mean_temp.isel(time=0)))
china_weight = china_weight/china_weight.sum()
china_weight.plot()
<matplotlib.collections.QuadMesh at 0x7fc0ac281dd0>
weighted_mean = (annual_china_mean_temp*china_weight).sum(dim=['lon','lat'])
weighted_mean
<xarray.DataArray (time: 69)>
array([6.00252245, 5.5262691 , 5.5719012 , 5.70178283, 5.63743712,
       5.78923133, 5.52567758, 5.55231086, 5.02751334, 5.05981022,
       5.80275971, 5.76755194, 5.5579304 , 5.58284571, 5.25716052,
       5.66430706, 5.37841569, 5.5736212 , 5.70741857, 5.12341224,
       5.35255999, 5.21369367, 5.38544521, 5.14870246, 5.16982935,
       5.61039527, 4.87386947, 5.38338392, 4.97444959, 5.54149615,
       5.45099197, 5.60702818, 5.46653624, 5.39721418, 5.59683034,
       5.34149105, 4.9014431 , 5.17419616, 5.26396819, 5.77013423,
       5.62259181, 5.53908119, 5.93941256, 5.56128708, 5.3924108 ,
       5.34070857, 5.81930224, 5.56635797, 5.34298067, 5.90813401,
       6.53288502, 6.2486403 , 5.64889475, 6.08367246, 6.1787809 ,
       5.89860635, 6.13613846, 5.80128953, 6.48765794, 6.54522217,
       6.01826287, 6.13936008, 6.03853043, 5.63487924, 5.45795952,
       6.35044402, 6.30444362, 6.62997998, 6.75963839])
Coordinates:
  * time     (time) datetime64[ns] 1948-01-01 1949-01-01 ... 2016-01-01
china_anomaly = weighted_mean - weighted_mean.mean()
t = china_anomaly.time.dt.year.values
X = t - t.mean()
slope, y0, beta_lr, beta_up = stats.mstats.theilslopes(china_anomaly.values, X,
alpha=0.95)
print('Mean value = ', y0)
print('Trend = ', slope)
print('95% confidence interval:', '[', beta_lr, ',', beta_up, ']')
Mean value =  -0.07456140253892407
Trend =  0.010559139967498625
95% confidence interval: [ 0.00609306997127276 , 0.016278539880497767 ]
fig,ax=plt.subplots()

china_anomaly.plot(ax=ax)
anomaly.plot(ax=ax,color='k')
ax.axhline(0,linestyle='--',color='grey')
ax.set_xlabel('Year')
ax.set_ylim([-1,1.5])
ax.set_ylabel('China annual temperature anomaly ('+u'\u00B0'+'C)')  # 度的 unicode

ax.plot(china_anomaly.time, y0+slope*(t-t.mean()),color='r')
ax.plot(china_anomaly.time, y0+beta_lr*(t-t.mean()),color='tab:red',linestyle='-.')
ax.plot(china_anomaly.time, y0+beta_up*(t-t.mean()),color='tab:red',linestyle='-.')
[<matplotlib.lines.Line2D at 0x7fc0a9e58290>]
WRF 数据处理和可视化
WRF(Weather Research and Forecasting)是广泛应用的区域气象模式
WRF 是大家数值天气预报课程使用的模式
WRF 模式的输出是 netCDF 文件,但不是符合 CF(Climate and Forecasting)标准的文件
NCAR 提供了
wrf-python模块来实现 NCL 中关于 WRF 的部分功能,也提供了xarray的接口
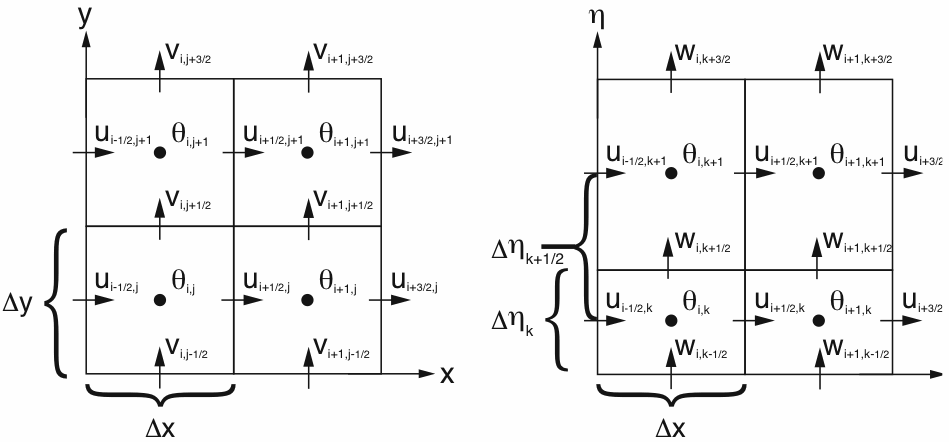
WRF 使用交错网格,即 Arakawa C 网格
!ncdump -h wrfout_d01_2015-09-24_13_extracted.nc
netcdf wrfout_d01_2015-09-24_13_extracted {
dimensions:
	Time = UNLIMITED ; // (1 currently)
	bottom_top = 50 ;
	south_north = 449 ;
	west_east = 649 ;
	bottom_top_stag = 51 ;
	DateStrLen = 19 ;
	west_east_stag = 650 ;
	south_north_stag = 450 ;
variables:
	float EXTCOF55(Time, bottom_top, south_north, west_east) ;
		EXTCOF55:FieldType = 104 ;
		EXTCOF55:MemoryOrder = "XYZ" ;
		EXTCOF55:description = "Extinction coefficients for .55um" ;
		EXTCOF55:units = "km^-1" ;
		EXTCOF55:stagger = "" ;
		EXTCOF55:coordinates = "XLONG XLAT XTIME" ;
	float HGT(Time, south_north, west_east) ;
		HGT:FieldType = 104 ;
		HGT:MemoryOrder = "XY " ;
		HGT:description = "Terrain Height" ;
		HGT:units = "m" ;
		HGT:stagger = "" ;
		HGT:coordinates = "XLONG XLAT XTIME" ;
	float P(Time, bottom_top, south_north, west_east) ;
		P:FieldType = 104 ;
		P:MemoryOrder = "XYZ" ;
		P:description = "perturbation pressure" ;
		P:units = "Pa" ;
		P:stagger = "" ;
		P:coordinates = "XLONG XLAT XTIME" ;
	float PB(Time, bottom_top, south_north, west_east) ;
		PB:FieldType = 104 ;
		PB:MemoryOrder = "XYZ" ;
		PB:description = "BASE STATE PRESSURE" ;
		PB:units = "Pa" ;
		PB:stagger = "" ;
		PB:coordinates = "XLONG XLAT XTIME" ;
	float PH(Time, bottom_top_stag, south_north, west_east) ;
		PH:FieldType = 104 ;
		PH:MemoryOrder = "XYZ" ;
		PH:description = "perturbation geopotential" ;
		PH:units = "m2 s-2" ;
		PH:stagger = "Z" ;
		PH:coordinates = "XLONG XLAT XTIME" ;
	float PHB(Time, bottom_top_stag, south_north, west_east) ;
		PHB:FieldType = 104 ;
		PHB:MemoryOrder = "XYZ" ;
		PHB:description = "base-state geopotential" ;
		PHB:units = "m2 s-2" ;
		PHB:stagger = "Z" ;
		PHB:coordinates = "XLONG XLAT XTIME" ;
	float PM2_5_DRY(Time, bottom_top, south_north, west_east) ;
		PM2_5_DRY:FieldType = 104 ;
		PM2_5_DRY:MemoryOrder = "XYZ" ;
		PM2_5_DRY:description = "pm2.5 aerosol dry mass" ;
		PM2_5_DRY:units = "ug m^-3" ;
		PM2_5_DRY:stagger = "" ;
		PM2_5_DRY:coordinates = "XLONG XLAT XTIME" ;
	float T(Time, bottom_top, south_north, west_east) ;
		T:FieldType = 104 ;
		T:MemoryOrder = "XYZ" ;
		T:description = "perturbation potential temperature (theta-t0)" ;
		T:units = "K" ;
		T:stagger = "" ;
		T:coordinates = "XLONG XLAT XTIME" ;
	char Times(Time, DateStrLen) ;
	float U(Time, bottom_top, south_north, west_east_stag) ;
		U:FieldType = 104 ;
		U:MemoryOrder = "XYZ" ;
		U:description = "x-wind component" ;
		U:units = "m s-1" ;
		U:stagger = "X" ;
		U:coordinates = "XLONG_U XLAT_U XTIME" ;
	float V(Time, bottom_top, south_north_stag, west_east) ;
		V:FieldType = 104 ;
		V:MemoryOrder = "XYZ" ;
		V:description = "y-wind component" ;
		V:units = "m s-1" ;
		V:stagger = "Y" ;
		V:coordinates = "XLONG_V XLAT_V XTIME" ;
	float W(Time, bottom_top_stag, south_north, west_east) ;
		W:FieldType = 104 ;
		W:MemoryOrder = "XYZ" ;
		W:description = "z-wind component" ;
		W:units = "m s-1" ;
		W:stagger = "Z" ;
		W:coordinates = "XLONG XLAT XTIME" ;
	float XLAT(Time, south_north, west_east) ;
		XLAT:FieldType = 104 ;
		XLAT:MemoryOrder = "XY " ;
		XLAT:description = "LATITUDE, SOUTH IS NEGATIVE" ;
		XLAT:units = "degree_north" ;
		XLAT:stagger = "" ;
		XLAT:coordinates = "XLONG XLAT" ;
	float XLAT_U(Time, south_north, west_east_stag) ;
		XLAT_U:FieldType = 104 ;
		XLAT_U:MemoryOrder = "XY " ;
		XLAT_U:description = "LATITUDE, SOUTH IS NEGATIVE" ;
		XLAT_U:units = "degree_north" ;
		XLAT_U:stagger = "X" ;
		XLAT_U:coordinates = "XLONG_U XLAT_U" ;
	float XLAT_V(Time, south_north_stag, west_east) ;
		XLAT_V:FieldType = 104 ;
		XLAT_V:MemoryOrder = "XY " ;
		XLAT_V:description = "LATITUDE, SOUTH IS NEGATIVE" ;
		XLAT_V:units = "degree_north" ;
		XLAT_V:stagger = "Y" ;
		XLAT_V:coordinates = "XLONG_V XLAT_V" ;
	float XLONG(Time, south_north, west_east) ;
		XLONG:FieldType = 104 ;
		XLONG:MemoryOrder = "XY " ;
		XLONG:description = "LONGITUDE, WEST IS NEGATIVE" ;
		XLONG:units = "degree_east" ;
		XLONG:stagger = "" ;
		XLONG:coordinates = "XLONG XLAT" ;
	float XLONG_U(Time, south_north, west_east_stag) ;
		XLONG_U:FieldType = 104 ;
		XLONG_U:MemoryOrder = "XY " ;
		XLONG_U:description = "LONGITUDE, WEST IS NEGATIVE" ;
		XLONG_U:units = "degree_east" ;
		XLONG_U:stagger = "X" ;
		XLONG_U:coordinates = "XLONG_U XLAT_U" ;
	float XLONG_V(Time, south_north_stag, west_east) ;
		XLONG_V:FieldType = 104 ;
		XLONG_V:MemoryOrder = "XY " ;
		XLONG_V:description = "LONGITUDE, WEST IS NEGATIVE" ;
		XLONG_V:units = "degree_east" ;
		XLONG_V:stagger = "Y" ;
		XLONG_V:coordinates = "XLONG_V XLAT_V" ;
	float ZNU(Time, bottom_top) ;
		ZNU:FieldType = 104 ;
		ZNU:MemoryOrder = "Z  " ;
		ZNU:description = "eta values on half (mass) levels" ;
		ZNU:units = "" ;
		ZNU:stagger = "" ;
	float ZNW(Time, bottom_top_stag) ;
		ZNW:FieldType = 104 ;
		ZNW:MemoryOrder = "Z  " ;
		ZNW:description = "eta values on full (w) levels" ;
		ZNW:units = "" ;
		ZNW:stagger = "Z" ;

// global attributes:
		:TITLE = " OUTPUT FROM *             PROGRAM:WRF-Chem V3.9.1.1 MODEL" ;
		:START_DATE = "2015-09-22_00:00:00" ;
		:SIMULATION_START_DATE = "2015-09-01_00:00:00" ;
		:WEST-EAST_GRID_DIMENSION = 650 ;
		:SOUTH-NORTH_GRID_DIMENSION = 450 ;
		:BOTTOM-TOP_GRID_DIMENSION = 51 ;
		:DX = 5000.f ;
		:DY = 5000.f ;
		:SKEBS_ON = 0 ;
		:SPEC_BDY_FINAL_MU = 1 ;
		:USE_Q_DIABATIC = 0 ;
		:GRIDTYPE = "C" ;
		:DIFF_OPT = 1 ;
		:KM_OPT = 4 ;
		:DAMP_OPT = 0 ;
		:DAMPCOEF = 0.2f ;
		:KHDIF = 0.f ;
		:KVDIF = 0.f ;
		:MP_PHYSICS = 10 ;
		:RA_LW_PHYSICS = 4 ;
		:RA_SW_PHYSICS = 4 ;
		:SF_SFCLAY_PHYSICS = 1 ;
		:SF_SURFACE_PHYSICS = 2 ;
		:BL_PBL_PHYSICS = 1 ;
		:CU_PHYSICS = 0 ;
		:SF_LAKE_PHYSICS = 0 ;
		:SURFACE_INPUT_SOURCE = 1 ;
		:SST_UPDATE = 0 ;
		:GRID_FDDA = 0 ;
		:GFDDA_INTERVAL_M = 0 ;
		:GFDDA_END_H = 0 ;
		:GRID_SFDDA = 0 ;
		:SGFDDA_INTERVAL_M = 0 ;
		:SGFDDA_END_H = 0 ;
		:HYPSOMETRIC_OPT = 2 ;
		:USE_THETA_M = 0 ;
		:GWD_OPT = 0 ;
		:SF_URBAN_PHYSICS = 0 ;
		:SF_OCEAN_PHYSICS = 0 ;
		:SHCU_PHYSICS = 0 ;
		:MFSHCONV = 0 ;
		:FEEDBACK = 0 ;
		:SMOOTH_OPTION = 0 ;
		:SWRAD_SCAT = 1.f ;
		:W_DAMPING = 1 ;
		:DT = 30.f ;
		:RADT = 30.f ;
		:BLDT = 1.f ;
		:CUDT = 1.f ;
		:AER_OPT = 0 ;
		:SWINT_OPT = 0 ;
		:AER_TYPE = 1 ;
		:AER_AOD550_OPT = 1 ;
		:AER_ANGEXP_OPT = 1 ;
		:AER_SSA_OPT = 1 ;
		:AER_ASY_OPT = 1 ;
		:AER_AOD550_VAL = 0.12f ;
		:AER_ANGEXP_VAL = 1.3f ;
		:AER_SSA_VAL = 0.85f ;
		:AER_ASY_VAL = 0.9f ;
		:MOIST_ADV_OPT = 2 ;
		:SCALAR_ADV_OPT = 2 ;
		:TKE_ADV_OPT = 2 ;
		:DIFF_6TH_OPT = 0 ;
		:DIFF_6TH_FACTOR = 0.12f ;
		:OBS_NUDGE_OPT = 0 ;
		:BUCKET_MM = -1.f ;
		:BUCKET_J = -1.f ;
		:PREC_ACC_DT = 0.f ;
		:ISFTCFLX = 0 ;
		:ISHALLOW = 0 ;
		:ISFFLX = 1 ;
		:ICLOUD = 1 ;
		:ICLOUD_CU = 0 ;
		:TRACER_PBLMIX = 1 ;
		:SCALAR_PBLMIX = 0 ;
		:YSU_TOPDOWN_PBLMIX = 0 ;
		:GRAV_SETTLING = 0 ;
		:DFI_OPT = 0 ;
		:SIMULATION_INITIALIZATION_TYPE = "REAL-DATA CASE" ;
		:WEST-EAST_PATCH_START_UNSTAG = 1 ;
		:WEST-EAST_PATCH_END_UNSTAG = 649 ;
		:WEST-EAST_PATCH_START_STAG = 1 ;
		:WEST-EAST_PATCH_END_STAG = 650 ;
		:SOUTH-NORTH_PATCH_START_UNSTAG = 1 ;
		:SOUTH-NORTH_PATCH_END_UNSTAG = 449 ;
		:SOUTH-NORTH_PATCH_START_STAG = 1 ;
		:SOUTH-NORTH_PATCH_END_STAG = 450 ;
		:BOTTOM-TOP_PATCH_START_UNSTAG = 1 ;
		:BOTTOM-TOP_PATCH_END_UNSTAG = 50 ;
		:BOTTOM-TOP_PATCH_START_STAG = 1 ;
		:BOTTOM-TOP_PATCH_END_STAG = 51 ;
		:GRID_ID = 1 ;
		:PARENT_ID = 0 ;
		:I_PARENT_START = 1 ;
		:J_PARENT_START = 1 ;
		:PARENT_GRID_RATIO = 1 ;
		:CEN_LAT = 0.f ;
		:CEN_LON = 107.f ;
		:TRUELAT1 = 0.f ;
		:TRUELAT2 = 1.e+20f ;
		:MOAD_CEN_LAT = 0.f ;
		:STAND_LON = 107.f ;
		:POLE_LAT = 90.f ;
		:POLE_LON = 0.f ;
		:GMT = 0.f ;
		:JULYR = 2015 ;
		:JULDAY = 244 ;
		:MAP_PROJ = 3 ;
		:MAP_PROJ_CHAR = "Mercator" ;
		:MMINLU = "MODIFIED_IGBP_MODIS_NOAH" ;
		:NUM_LAND_CAT = 20 ;
		:ISWATER = 17 ;
		:ISLAKE = -1 ;
		:ISICE = 15 ;
		:ISURBAN = 13 ;
		:ISOILWATER = 14 ;
		:HYBRID_OPT = -1 ;
		:ETAC = 0.f ;
		:history = "Thu Apr 16 22:21:49 2020: ncks -v Times,XLAT,XLONG,XLAT_U,XLONG_U,XLAT_V,XLONG_V,U,V,W,W,PH,PHB,T,P,PB,PM2_5_DRY,EXTCOF55,ZNW,ZNU,HGT wrfout_d01_2015-09-24_13:00:00 wrfout_d01_2015-09-24_13_extracted.nc" ;
		:NCO = "\"4.5.5\"" ;
}
import wrf
import xarray
from netCDF4 import Dataset
首先读入文件
ifile = 'wrfout_d01_2015-09-24_13_extracted.nc'
title_str = '21:00 24 Sep 2015'
file_str = '20150924_2100'

fin = Dataset(ifile)
其次,读取所需的变量
PM25 = wrf.getvar(fin,'PM2_5_DRY')
lats, lons = wrf.latlon_coords(PM25)
cart_proj = wrf.get_cartopy(PM25)
p = wrf.getvar(fin, "pressure")
ua = wrf.getvar(fin, "ua", units="m s-1")
va = wrf.getvar(fin, "va", units="m s-1")
wspd = wrf.getvar(fin, "wspd_wdir", units="m s-1")[0,:]
再将相关变量插值到 925 hPa 高度(海拔约 1 km)
# Interpolate u, and v winds to 925 hPa
u_925 = wrf.interplevel(ua, p, 925)
v_925 = wrf.interplevel(va, p, 925)
wspd_925 = wrf.interplevel(wspd, p, 925)
import matplotlib.pyplot as plt
import cartopy.crs as ccrs
from cartopy.mpl.ticker import LongitudeFormatter, LatitudeFormatter
import matplotlib.ticker as mticker
fig, ax = plt.subplots(figsize=(9,6),subplot_kw={'projection':cart_proj})

PM25.sel(bottom_top=0).plot.contourf(x='XLONG',y='XLAT',vmin=0,vmax=300,
        levels=11,transform=ccrs.PlateCarree(),
        ax=ax,cmap='Blues',cbar_kwargs={'label':''})
ax.coastlines('10m')
ax.set_extent([95,120,-10,10], crs=ccrs.PlateCarree())
ax.set_xticks([100,110,120], crs=ccrs.PlateCarree())
ax.set_yticks([-10,0,10], crs=ccrs.PlateCarree())
ax.set_xlabel('')
ax.set_ylabel('')
lon_formatter = LongitudeFormatter(zero_direction_label=True)
lat_formatter = LatitudeFormatter()
ax.xaxis.set_major_formatter(lon_formatter)
ax.yaxis.set_major_formatter(lat_formatter)

gl = ax.gridlines(crs=ccrs.PlateCarree(), draw_labels=False,\
          linewidth=1, color='gray', alpha=0.5, linestyle='--')
gl.xlocator = mticker.FixedLocator([90, 100, 110, 120])
gl.ylocator = mticker.FixedLocator([-10, 0, 10, 20])

ax.set_title('PM2.5 ($\mu$g m$^{-3}$) at '+title_str,fontdict={'size':16})

Q = ax.quiver(wrf.to_np(lons[::20,::20]), wrf.to_np(lats[::20,::20]),
        wrf.to_np(u_925[::20, ::20]), wrf.to_np(v_925[::20, ::20]),
        transform=ccrs.PlateCarree(),units='inches')
qk = ax.quiverkey(Q, 0.75, 0.9, 8, r'8 ms$^{-1}$', labelpos='N',
        labelsep=0.01, coordinates='figure')

#plot the line for cross plotting
start_point = wrf.CoordPair(lat=-5.55, lon=104.77)
end_point = wrf.CoordPair(lat=5.32, lon=103.2661)
ax.plot([start_point.lon, end_point.lon],
        [start_point.lat, end_point.lat], color="red", marker="o",
        transform=ccrs.PlateCarree())
/opt/miniconda3/lib/python3.7/site-packages/cartopy/mpl/geoaxes.py:1841: RuntimeWarning: invalid value encountered in cos
  u, v = self.projection.transform_vectors(t, x, y, u, v)
/opt/miniconda3/lib/python3.7/site-packages/cartopy/mpl/geoaxes.py:1841: RuntimeWarning: invalid value encountered in sin
  u, v = self.projection.transform_vectors(t, x, y, u, v)
[<matplotlib.lines.Line2D at 0x7fc07537e910>]
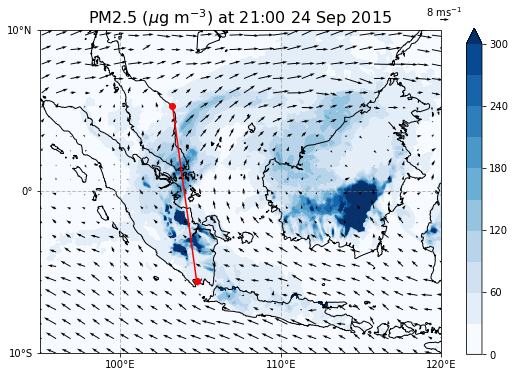
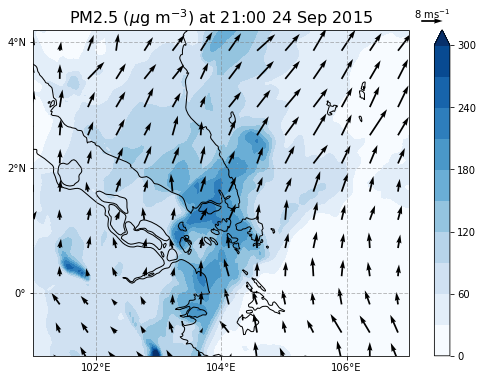
由于研究重点是对新加坡空气质量的影响,我们将上图缩进到新加坡周边
# zoomed view around Singapore
PM25_zoom = PM25.sel(bottom_top=0,south_north=slice(200,320),west_east=slice(190,330))
u_925_zoom = u_925.sel(south_north=slice(200,320),west_east=slice(190,330))
v_925_zoom = v_925.sel(south_north=slice(200,320),west_east=slice(190,330))
lats_zoom, lons_zoom = wrf.latlon_coords(PM25_zoom)
cart_proj = wrf.get_cartopy(PM25_zoom)

fig2, ax2 = plt.subplots(figsize=(9,6),subplot_kw={'projection':cart_proj})

PM25_zoom.plot.contourf(x='XLONG',y='XLAT',vmin=0,vmax=300,
         levels=11,transform=ccrs.PlateCarree(),
         ax=ax2,cmap='Blues',cbar_kwargs={'label':''})
ax2.coastlines('10m')
ax2.set_extent([101,107,-1,4.2],crs=ccrs.PlateCarree())
ax2.set_xticks([102,104,106],crs=ccrs.PlateCarree())
ax2.set_yticks([0,2,4],crs=ccrs.PlateCarree())
ax2.set_xlabel('')
ax2.set_ylabel('')
lon_formatter = LongitudeFormatter(zero_direction_label=True)
lat_formatter = LatitudeFormatter()
ax2.xaxis.set_major_formatter(lon_formatter)
ax2.yaxis.set_major_formatter(lat_formatter)
gl = ax2.gridlines(draw_labels=False,\
         linewidth=1, color='gray', alpha=0.5, linestyle='--')
gl.xlocator = mticker.FixedLocator([100, 102, 104, 106, 108])
gl.ylocator = mticker.FixedLocator([-2, 0, 2, 4, 6])

ax2.set_title('PM2.5 ($\mu$g m$^{-3}$) at '+title_str,fontdict={'size':16})

Q2 = ax2.quiver(wrf.to_np(lons_zoom[::10,::10]), wrf.to_np(lats_zoom[::10,::10]),
         wrf.to_np(u_925_zoom[::10, ::10]), wrf.to_np(v_925_zoom[::10, ::10]),
         transform=ccrs.PlateCarree(), units='inches')
qk2 = ax2.quiverkey(Q2, 0.78, 0.9, 8, r'8 ms$^{-1}$', labelpos='N',
         labelsep=0.01, coordinates='figure')
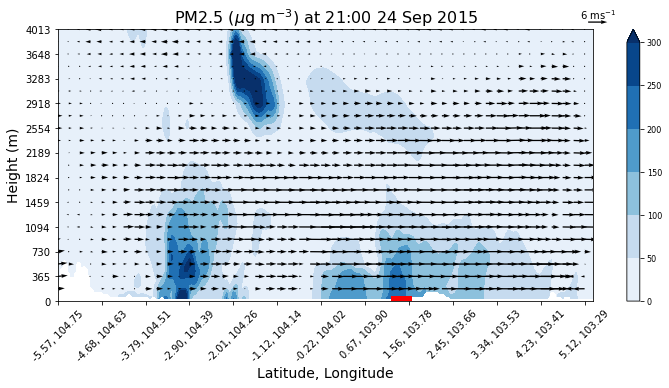
z = wrf.getvar(fin, "z", units="m")
wa = wrf.getvar(fin, "wa", units="m s-1")

start_point = wrf.CoordPair(lat=-5.55, lon=104.77)
end_point = wrf.CoordPair(lat=5.32, lon=103.2661)

PM25_cross = wrf.vertcross(PM25, z, wrfin=fin, start_point=start_point,
                 end_point=end_point, autolevels=500,latlon=True, meta=True)
va_cross = wrf.vertcross(va, z, wrfin=fin, start_point=start_point,
                 end_point=end_point, autolevels=500,latlon=True, meta=True)
wa_cross = wrf.vertcross(wa, z, wrfin=fin, start_point=start_point,
                 end_point=end_point, autolevels=500,latlon=True, meta=True)

fig3,ax3 = plt.subplots(figsize=(12,5))
vert_vals = wrf.to_np(PM25_cross.coords["vertical"])
vert_level = np.argmax(vert_vals>4000.0)

contour_levels = [0, 50, 100, 150, 200, 250, 300]
PM25_contour = ax3.contourf(wrf.to_np(PM25_cross)[:vert_level+1,:],contour_levels,
                            cmap='Blues',extend='max')
PM25_contour.set_clim(vmin=0, vmax=300)
cb_PM25 = plt.colorbar(PM25_contour, ax=ax3)
cb_PM25.ax.tick_params(labelsize=8)

coord_pairs = wrf.to_np(PM25_cross.coords["xy_loc"])
x_ticks = np.arange(coord_pairs.shape[0])
x_labels = [pair.latlon_str("{:.2f}, {:.2f}") for pair in wrf.to_np(coord_pairs)]
ax3.set_xticks(x_ticks[::20])
ax3.set_xticklabels(x_labels[::20], rotation=45, fontsize=10)

vert_vals = vert_vals[:vert_level+1]
v_ticks = np.arange(vert_vals.shape[0])
y_labels = [f"{y:.0f}" for y in vert_vals]
ax3.set_yticks(v_ticks[::10])
ax3.set_yticklabels(y_labels[::10], fontsize=10)

ax3.set_xlabel("Latitude, Longitude", fontsize=14)
ax3.set_ylabel("Height (m)", fontsize=14)

Q3 = ax3.quiver(wrf.to_np(x_ticks[::5]),wrf.to_np(v_ticks[::5]),
        wrf.to_np(va_cross[:vert_level+1:5,::5]),
        wrf.to_np(wa_cross[:vert_level+1:5,::5]))
qk3 = ax3.quiverkey(Q3, 0.75, 0.9, 6, r'6 ms$^{-1}$', labelpos='N',
        labelsep=0.01, coordinates='figure')

singapore_start = 1.254
singapore_end = 1.478
line_lats, line_lons = wrf.pairs_to_latlon(coord_pairs)
ax_start = np.argmax(np.array(line_lats)>singapore_start)
ax_end = np.argmin(np.array(line_lats)<singapore_end)

ax3.plot([x_ticks[ax_start],x_ticks[ax_end]],
        [0,0],color="red", linewidth=10)

ax3.set_title('PM2.5 ($\mu$g m$^{-3}$) at '+title_str,fontdict={'size':16})
Text(0.5, 1.0, 'PM2.5 ($\\mu$g m$^{-3}$) at 21:00 24 Sep 2015')
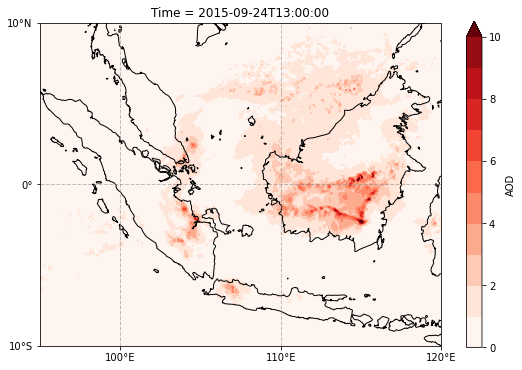
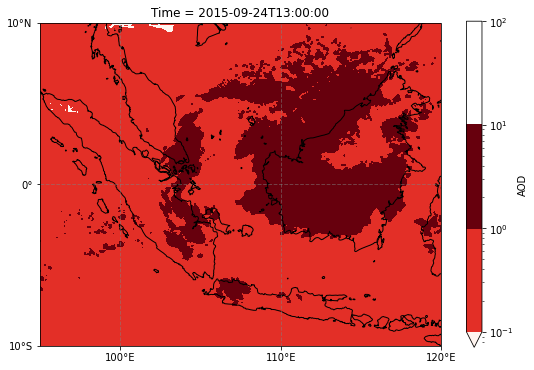
此外,我们还可以计算该区域的气溶胶光学厚度(aerosol optical depth, AOD)。它是消光系数在高度上的积分 $\( AOD = \int_0^{top}\tau(z) dz, \)\( 其中,\)z\( 为 WRF 网格的垂直高度,\)\tau(z)\( 为高度 \)z$ 处的消光系数。
这里我们使用 550 nm 光波的消光系数,WRF 中的变量名为 EXTCOF55。
zdiff = z.diff(dim='bottom_top')
extcof = wrf.getvar(fin,'EXTCOF55',squeeze=False)
aod = extcof.sel(bottom_top=slice(0,49))*zdiff
aod = aod.sum(dim='bottom_top')/1000.0  # EXTCOF55 单位为 "km^-1"
fin.close()
fig4, ax4 = plt.subplots(figsize=(9,6),subplot_kw={'projection':cart_proj})
aod.squeeze().plot.contourf(x='XLONG',y='XLAT',vmin=0,vmax=10,
        levels=11,transform=ccrs.PlateCarree(),
        ax=ax4,cmap='Reds',cbar_kwargs={'label':'AOD'})
ax4.coastlines('10m')
ax4.set_extent([95,120,-10,10], crs=ccrs.PlateCarree())
ax4.set_xticks([100,110,120], crs=ccrs.PlateCarree())
ax4.set_yticks([-10,0,10], crs=ccrs.PlateCarree())
ax4.set_xlabel('')
ax4.set_ylabel('')
lon_formatter = LongitudeFormatter(zero_direction_label=True)
lat_formatter = LatitudeFormatter()
ax4.xaxis.set_major_formatter(lon_formatter)
ax4.yaxis.set_major_formatter(lat_formatter)

gl = ax4.gridlines(crs=ccrs.PlateCarree(), draw_labels=False,\
          linewidth=1, color='gray', alpha=0.5, linestyle='--')
gl.xlocator = mticker.FixedLocator([90, 100, 110, 120])
gl.ylocator = mticker.FixedLocator([-10, 0, 10, 20])
from matplotlib import colors

fig5, ax5 = plt.subplots(figsize=(9,6),subplot_kw={'projection':cart_proj})
levels = np.power(10, [-1.,0.,1.,2.])
aod.squeeze().plot.contourf(x='XLONG',y='XLAT',#vmin=0,vmax=10,
        levels=levels,norm=colors.LogNorm(), transform=ccrs.PlateCarree(),
        ax=ax5, cmap='Reds',cbar_kwargs={'label':'AOD'})
ax5.coastlines('10m')
ax5.set_extent([95,120,-10,10], crs=ccrs.PlateCarree())
ax5.set_xticks([100,110,120], crs=ccrs.PlateCarree())
ax5.set_yticks([-10,0,10], crs=ccrs.PlateCarree())
ax5.set_xlabel('')
ax5.set_ylabel('')
lon_formatter = LongitudeFormatter(zero_direction_label=True)
lat_formatter = LatitudeFormatter()
ax5.xaxis.set_major_formatter(lon_formatter)
ax5.yaxis.set_major_formatter(lat_formatter)

gl = ax5.gridlines(crs=ccrs.PlateCarree(), draw_labels=False,\
          linewidth=1, color='gray', alpha=0.5, linestyle='--')
gl.xlocator = mticker.FixedLocator([90, 100, 110, 120])
gl.ylocator = mticker.FixedLocator([-10, 0, 10, 20])
NCL -> Python: geoCAT
MetPy
Unidata Python Gallery
https://unidata.github.io/python-training/gallery/gallery-home/
时间序列分析和可视化
Python 提供了很多辅助工具来处理时间序列
标准库:date, datetime
Pandas: pandas.to_datetime, pandas.date_range
Matplotlib: matplotlib.dates
我们利用 Global Historical Climate Network Daily (GHCND) 数据,探讨广州和阳江 1951-2019 气候日变化特征。
import pandas as pd
ghcnd = pd.read_csv('GHCN_GZ_YJ.csv')
ghcnd.info()
<class 'pandas.core.frame.DataFrame'>
RangeIndex: 50191 entries, 0 to 50190
Data columns (total 14 columns):
 #   Column           Non-Null Count  Dtype
---  ------           --------------  -----
 0   STATION          50191 non-null  object
 1   NAME             50191 non-null  object
 2   LATITUDE         50191 non-null  float64
 3   LONGITUDE        50191 non-null  float64
 4   ELEVATION        50191 non-null  float64
 5   DATE             50191 non-null  object
 6   PRCP             47952 non-null  float64
 7   PRCP_ATTRIBUTES  47952 non-null  object
 8   TAVG             50068 non-null  float64
 9   TAVG_ATTRIBUTES  50068 non-null  object
 10  TMAX             46154 non-null  float64
 11  TMAX_ATTRIBUTES  46154 non-null  object
 12  TMIN             48338 non-null  float64
 13  TMIN_ATTRIBUTES  48338 non-null  object
dtypes: float64(7), object(7)
memory usage: 5.4+ MB
ghcnd.DATE = pd.to_datetime(ghcnd.DATE)
ghcnd = ghcnd.drop(['ELEVATION','PRCP_ATTRIBUTES','TAVG_ATTRIBUTES',
                    'TMAX_ATTRIBUTES','TMIN_ATTRIBUTES'],axis=1)
gz = ghcnd[ghcnd.NAME=='GUANGZHOU, CH']
yj = ghcnd[ghcnd.NAME=='YANGJIANG, CH']
gz = gz.set_index('DATE')
yj = yj.set_index('DATE')
gz = gz['1949':'2019']
yj = yj['1949':'2019']
为确保时间序列的时间是连续的,一般需要重新指定 index 值
gz = gz.reindex(pd.date_range('1951-01-01','2019-12-31',freq='D'))
yj = yj.reindex(pd.date_range('1952-01-01','2019-12-31',freq='D'))
gz.describe()
| LATITUDE | LONGITUDE | PRCP | TAVG | TMAX | TMIN | |
|---|---|---|---|---|---|---|
| count | 2.517500e+04 | 2.517500e+04 | 24084.000000 | 25054.000000 | 22876.000000 | 24084.000000 |
| mean | 2.321700e+01 | 1.134830e+02 | 5.200872 | 22.270316 | 26.459901 | 18.962647 |
| std | 3.552784e-15 | 2.842227e-14 | 14.496849 | 6.167283 | 6.345923 | 6.306987 |
| min | 2.321700e+01 | 1.134830e+02 | 0.000000 | 2.900000 | 4.300000 | 0.000000 |
| 25% | 2.321700e+01 | 1.134830e+02 | 0.000000 | 17.700000 | 22.300000 | 14.200000 |
| 50% | 2.321700e+01 | 1.134830e+02 | 0.000000 | 23.700000 | 27.700000 | 20.600000 |
| 75% | 2.321700e+01 | 1.134830e+02 | 2.700000 | 27.400000 | 31.600000 | 24.400000 |
| max | 2.321700e+01 | 1.134830e+02 | 284.900000 | 34.400000 | 39.100000 | 30.400000 |
yj.describe()
| LATITUDE | LONGITUDE | PRCP | TAVG | TMAX | TMIN | |
|---|---|---|---|---|---|---|
| count | 2.480800e+04 | 2.480800e+04 | 23662.000000 | 24806.000000 | 23092.00000 | 24062.000000 |
| mean | 2.186700e+01 | 1.119670e+02 | 6.778747 | 22.545283 | 26.32681 | 19.702593 |
| std | 7.105571e-15 | 2.842228e-14 | 22.218934 | 5.512921 | 5.48785 | 5.842219 |
| min | 2.186700e+01 | 1.119670e+02 | 0.000000 | 3.200000 | 5.70000 | -1.400000 |
| 25% | 2.186700e+01 | 1.119670e+02 | 0.000000 | 18.600000 | 23.00000 | 15.400000 |
| 50% | 2.186700e+01 | 1.119670e+02 | 0.000000 | 23.900000 | 27.50000 | 21.400000 |
| 75% | 2.186700e+01 | 1.119670e+02 | 2.700000 | 27.200000 | 30.70000 | 24.600000 |
| max | 2.186700e+01 | 1.119670e+02 | 605.300000 | 32.300000 | 38.30000 | 28.800000 |
我们先来求历史上的最高、最低温度记录,以及最高日降雨量记录
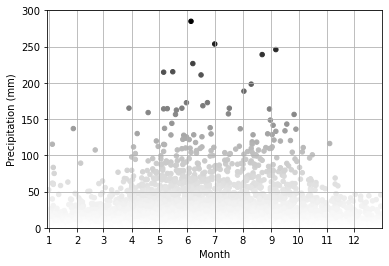
gz.TMAX.max(), gz.TMAX.idxmax(), gz.TMIN.min(), gz.TMIN.idxmin(), gz.PRCP.max(), gz.PRCP.idxmax()
(39.1,
 Timestamp('2004-07-01 00:00:00', freq='D'),
 0.0,
 Timestamp('1957-02-11 00:00:00', freq='D'),
 284.9,
 Timestamp('1955-06-06 00:00:00', freq='D'))
yj.TMAX.max(), yj.TMAX.idxmax(), yj.TMIN.min(), yj.TMIN.idxmin(), yj.PRCP.max(), yj.PRCP.idxmax()
(38.3,
 Timestamp('2005-07-19 00:00:00', freq='D'),
 -1.4,
 Timestamp('1955-01-12 00:00:00', freq='D'),
 605.3,
 Timestamp('2001-06-08 00:00:00', freq='D'))
gz.at[gz.index,'dayofyear'] = gz.index.dayofyear
yj.at[yj.index,'dayofyear'] = yj.index.dayofyear
ax = gz.plot.scatter('dayofyear','PRCP',c=gz.PRCP.values)
ax.set_xlim([-0.5,366.5])
ax.set_ylim([0,300])
ax.set_xticks([1,32,61,92,122,153,183,214,245,275,306,336])
ax.set_xticklabels([str(i) for i in range(1,13)])
ax.set_xlabel('Month')
ax.set_ylabel('Precipitation (mm)')
ax.grid()
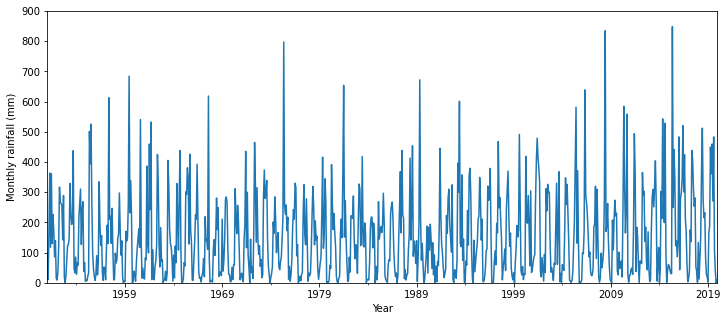
gz_monthly_rain = gz.PRCP.resample('M').sum()
fig,ax = plt.subplots(figsize=(12,5))
gz_monthly_rain.plot(ax=ax)
ax.set_ylim([0,900])
ax.set_xlabel('Year')
ax.set_ylabel('Monthly rainfall (mm)')
Text(0, 0.5, 'Monthly rainfall (mm)')
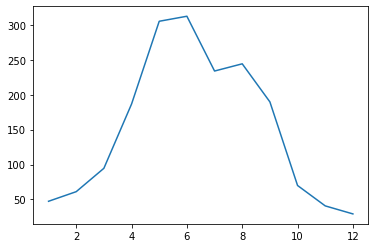
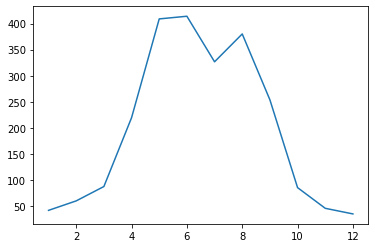
gz_monthly_rain.groupby(gz_monthly_rain.index.month).mean().plot()
<AxesSubplot:>
yj_monthly_rain = yj.PRCP.resample('M').sum()
yj_monthly_rain.groupby(yj_monthly_rain.index.month).mean().plot()
<AxesSubplot:>
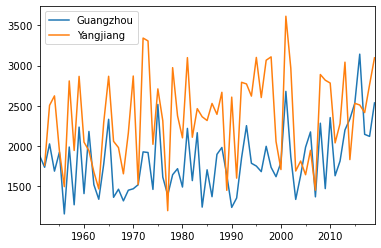
ax = gz.PRCP.resample('A').sum().plot(label='Guangzhou')
yj.PRCP.resample('A').sum().plot(ax=ax,label='Yangjiang')
ax.legend()
<matplotlib.legend.Legend at 0x7fc066513b10>
极端天气分析
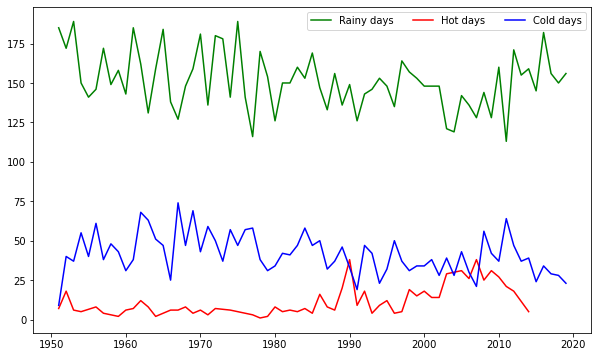
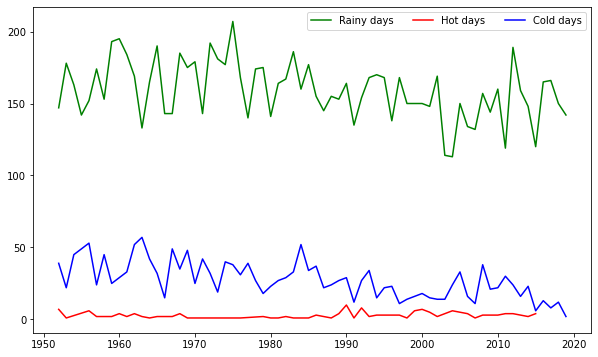
我们分析每年下雨的天数、高温(\(>35 ^oC\)) 的天数以及低温(\(<10 ^oC\))的天数
gz_rainyDays = gz[gz.PRCP>0.]
gz_rainyDays = gz_rainyDays.groupby(gz_rainyDays.index.year)['PRCP'].count()
gz_hotDays = gz[gz.TMAX>=35.0]
gz_hotDays = gz_hotDays.groupby(gz_hotDays.index.year)['TMAX'].count()
gz_coldDays = gz[gz.TMIN<=10.0]
gz_coldDays = gz_coldDays.groupby(gz_coldDays.index.year)['TMIN'].count()
fig,ax = plt.subplots(figsize=(10,6))

gz_rainyDays.plot(ax=ax,color='g',label='Rainy days')
gz_hotDays.plot(ax=ax,color='r',label='Hot days')
gz_coldDays.plot(ax=ax,color='b',label='Cold days')
ax.legend(ncol=3)
<matplotlib.legend.Legend at 0x7fc05cd90610>
yj_rainyDays = yj[yj.PRCP>0.]
yj_rainyDays = yj_rainyDays.groupby(yj_rainyDays.index.year)['PRCP'].count()
yj_hotDays = yj[yj.TMAX>=35.0]
yj_hotDays = yj_hotDays.groupby(yj_hotDays.index.year)['TMAX'].count()
yj_coldDays = yj[yj.TMIN<=10.0]
yj_coldDays = yj_coldDays.groupby(yj_coldDays.index.year)['TMIN'].count()
fig,ax = plt.subplots(figsize=(10,6))

yj_rainyDays.plot(ax=ax,color='g',label='Rainy days')
yj_hotDays.plot(ax=ax,color='r',label='Hot days')
yj_coldDays.plot(ax=ax,color='b',label='Cold days')
ax.legend(ncol=3)
<matplotlib.legend.Legend at 0x7fc05afcc410>
#ax = gz.TAVG.plot(kind='kde',label='Average')
#gz.TMAX.plot(ax=ax,kind='kde',label='Maximum')
#gz.TMIN.plot(ax=ax,kind='kde',label='Minimum')
#ax.legend()
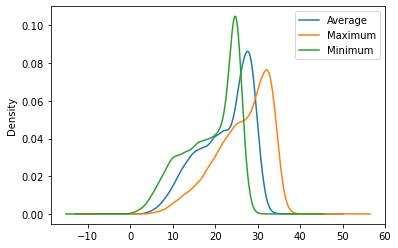
ax = gz[['TAVG','TMAX','TMIN']].plot.kde()
ax.legend(['Average','Maximum','Minimum'])
<matplotlib.legend.Legend at 0x7fc05b02b050>
import calendar
import seaborn as sns

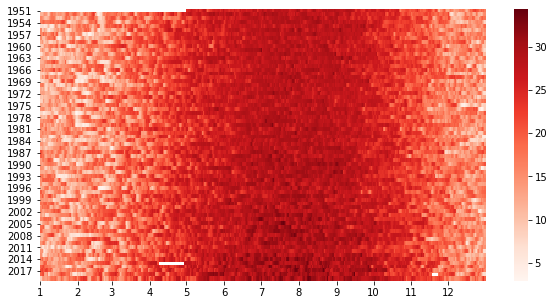
groups = gz.TAVG.groupby(pd.Grouper(freq='AS'))
years = pd.DataFrame()

for name, group in groups:
    if calendar.isleap(name.year):
        years[name.year] = np.delete(group.values,59)
    else:
        years[name.year] = group.values

years = years.T
fig,ax = plt.subplots(figsize=(10,5))
sns.heatmap(years,cmap='Reds')
ax.set_xticks([0,31,59,90,120,151,181,212,243,273,304,334])
ax.set_xticklabels([str(i) for i in range(1,13)],rotation=0)
[Text(0, 0, '1'),
 Text(31, 0, '2'),
 Text(59, 0, '3'),
 Text(90, 0, '4'),
 Text(120, 0, '5'),
 Text(151, 0, '6'),
 Text(181, 0, '7'),
 Text(212, 0, '8'),
 Text(243, 0, '9'),
 Text(273, 0, '10'),
 Text(304, 0, '11'),
 Text(334, 0, '12')]
fig,ax = plt.subplots(figsize=(10,6))
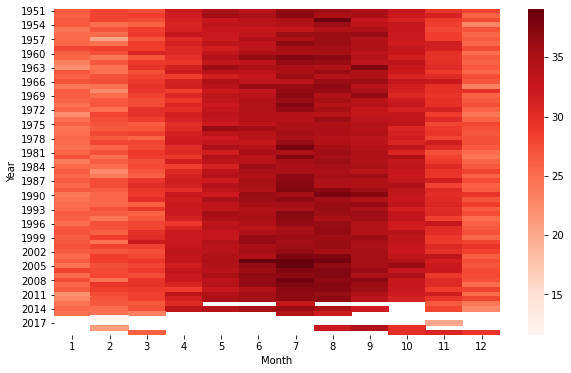
gz_annual_max_temp = gz.TMAX.resample('MS').max()
gz_annual_max_temp = pd.DataFrame(gz_annual_max_temp)
gz_annual_max_temp['Year'] = gz_annual_max_temp.index.year
gz_annual_max_temp['Month'] = gz_annual_max_temp.index.month
max_temp = gz_annual_max_temp.pivot("Year","Month","TMAX")
sns.heatmap(max_temp,cmap='Reds')
<AxesSubplot:xlabel='Month', ylabel='Year'>
fig,ax = plt.subplots(figsize=(10,6))
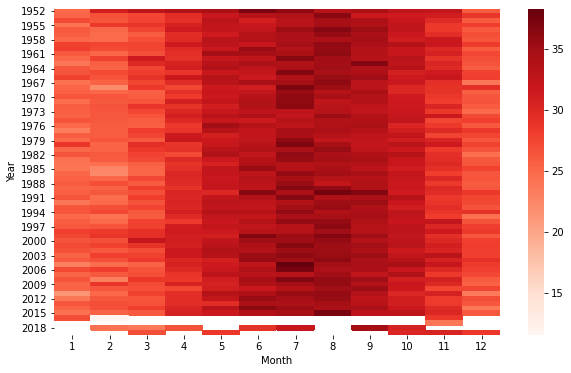
yj_annual_max_temp = yj.TMAX.resample('MS').max()
yj_annual_max_temp = pd.DataFrame(yj_annual_max_temp)
yj_annual_max_temp['Year'] = yj_annual_max_temp.index.year
yj_annual_max_temp['Month'] = yj_annual_max_temp.index.month
max_temp = yj_annual_max_temp.pivot("Year","Month","TMAX")
sns.heatmap(max_temp,cmap='Reds')
<AxesSubplot:xlabel='Month', ylabel='Year'>
gz['DTR'] = gz['TMAX']-gz['TMIN']
gz.DTR.groupby(gz.index.month).mean().plot()
yj['DTR'] = yj['TMAX']-yj['TMIN']
yj.DTR.groupby(yj.index.month).mean().plot()
<AxesSubplot:>
