厄尔尼诺/拉尼娜 (El Nino/La Nina) 现象
Contents
import numpy as np
import xarray as xr
import matplotlib.pyplot as plt

%matplotlib inline
厄尔尼诺/拉尼娜 (El Nino/La Nina) 现象
https://www.ncdc.noaa.gov/teleconnections/enso/indicators/sst.php
El Niño (La Niña) 现象指的是热带太平洋海面温度(Sea Surface Temperature, SST)随时间的震荡变化。El Niño 时,该平均海温比长期平均值高,而 La Niña 时,该平均海温较长期平均值低。通常以 0.5 °C 为阈值(即高出0.5 °C或低于-0.5 °C才认为发生 El Niño/La Niña 现象)。计算时通常取3个月的滚动平均值,并需要连续5个月满足条件,才会认定该年份为 El Niño 或 La Niña 年,否则为中性年。该温度差值被称为 Oceanic Niño Index (ONI)。
El Niño (La Niña) is a phenomenon in the equatorial Pacific Ocean characterized by a five consecutive 3-month running mean of sea surface temperature (SST) anomalies in the Niño 3.4 region that is above (below) the threshold of +0.5°C (-0.5°C). This standard of measure is known as the Oceanic Niño Index (ONI).
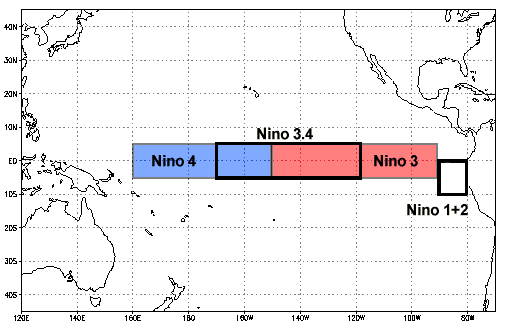
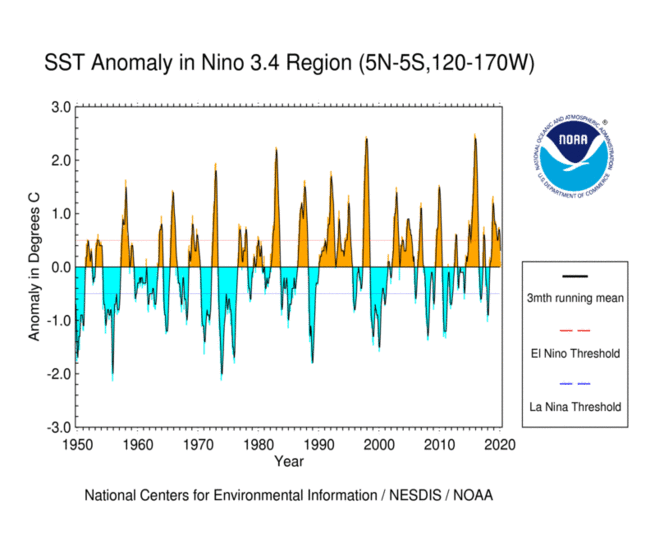
如上图所示,ONI 可以在多个区域进行计算。常用的为 Nino3.4(对应图中标示为3.4的区域),即 5°N - 5°S,120 - 170°W。Nino3.4 结果如下图:
数据
我们使用 NOAA 的 Extended Reconstructed Sea Surface Temperature (ERSST) V5 (https://www.esrl.noaa.gov/psd/data/gridded/data.noaa.ersst.v5.html) 月平均温度数据来计算 Nino3.4 指数,并绘出上面的图。
sst = xr.open_dataarray('sst.mnmean.1950-2019.nc')
sst
<xarray.DataArray 'sst' (time: 840, lat: 89, lon: 180)>
[13456800 values with dtype=float32]
Coordinates:
  * lat      (lat) float32 88.0 86.0 84.0 82.0 80.0 ... -82.0 -84.0 -86.0 -88.0
  * lon      (lon) float32 0.0 2.0 4.0 6.0 8.0 ... 350.0 352.0 354.0 356.0 358.0
  * time     (time) datetime64[ns] 1950-01-01 1950-02-01 ... 2019-12-01
Attributes:
    long_name:     Monthly Means of Sea Surface Temperature
    units:         degC
    var_desc:      Sea Surface Temperature
    level_desc:    Surface
    statistic:     Mean
    dataset:       NOAA Extended Reconstructed SST V5
    parent_stat:   Individual Values
    actual_range:  [-1.8     42.32636]
    valid_range:   [-1.8 45. ]
注意经度是 0 - 360 度,纬度是 88 - -88 度 (逆序)
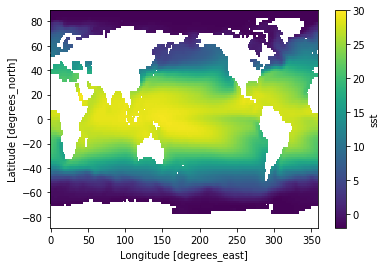
sst.mean(dim='time').plot(vmin=-2, vmax=30)
/Users/lixx/miniconda3/lib/python3.7/site-packages/xarray/core/nanops.py:142: RuntimeWarning: Mean of empty slice
  return np.nanmean(a, axis=axis, dtype=dtype)
<matplotlib.collections.QuadMesh at 0x11f0a76d0>
作业1 
请将上图进行美化:
将经度改为 -180 - 180 度
增加投影信息(PlateCarree)
加上海岸线
在坐标轴标签改成格式化的经纬度 (如 90°E,20°N等)
将坐标轴的标题(‘Longitude’,’Latitude‘)去掉
# 你的代码
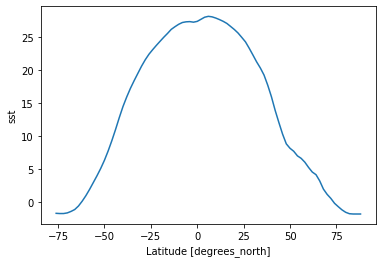
sst_zonal_time_mean = sst.mean(dim=('time', 'lon'))
sst_zonal_time_mean.plot()
[<matplotlib.lines.Line2D at 0x11f761ed0>]
我们可以来看看海温异常(anomaly)随时间和纬度的变化
(sst.mean(dim='lon') - sst_zonal_time_mean).T.plot()
/Users/lixx/miniconda3/lib/python3.7/site-packages/xarray/core/nanops.py:142: RuntimeWarning: Mean of empty slice
  return np.nanmean(a, axis=axis, dtype=dtype)
<matplotlib.collections.QuadMesh at 0x117605390>
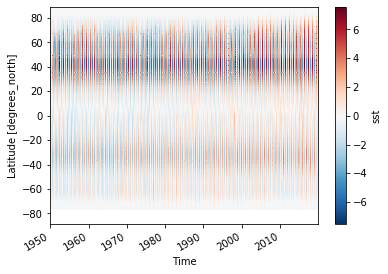
不同纬度处的海温变化幅度是不同的
sst.sel(lon=120, lat=17, method='nearest').plot(color='r')
sst.sel(lon=120, lat=0, method='nearest').plot(color='b')
[<matplotlib.lines.Line2D at 0x11f3f8ad0>]
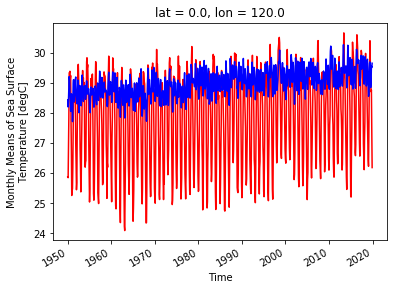
SST 异常(anomaly)
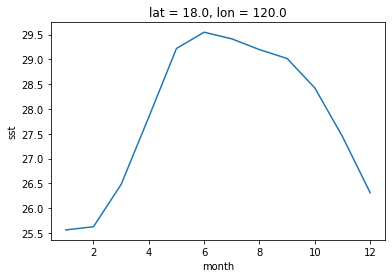
# 气候(即长期平均值)
sst_clim = sst.groupby('time.month').mean(dim='time')
sst_clim.sel(lon=120, lat=17, method='nearest').plot()
/Users/lixx/miniconda3/lib/python3.7/site-packages/xarray/core/nanops.py:142: RuntimeWarning: Mean of empty slice
  return np.nanmean(a, axis=axis, dtype=dtype)
[<matplotlib.lines.Line2D at 0x11f8a0d10>]
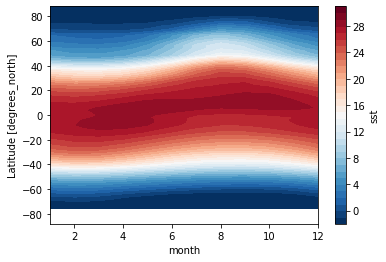
# Hovmoller 图
sst_clim.mean(dim='lon').T.plot.contourf(levels=np.arange(-2,32))
/Users/lixx/miniconda3/lib/python3.7/site-packages/xarray/core/nanops.py:142: RuntimeWarning: Mean of empty slice
  return np.nanmean(a, axis=axis, dtype=dtype)
<matplotlib.contour.QuadContourSet at 0x11c49ccd0>
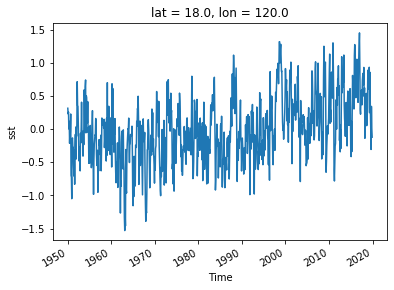
我们可以计算海温的异常值(即瞬时值 - 气候)
sst_anom = sst.groupby('time.month') - sst_clim
sst_anom.sel(lon=120, lat=17, method='nearest').plot()
[<matplotlib.lines.Line2D at 0x11bb3a610>]
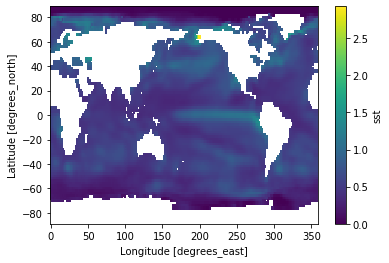
sst_anom.std(dim='time').plot()
/Users/lixx/miniconda3/lib/python3.7/site-packages/numpy/lib/nanfunctions.py:1667: RuntimeWarning: Degrees of freedom <= 0 for slice.
  keepdims=keepdims)
<matplotlib.collections.QuadMesh at 0x11bcf1410>
作业2
绘制 NOAA 的 Nino3.4 曲线图 (本文件从上往下数第2张图)
计算Nino3.4区域内的海温异常的空间平均值(即对经度和纬度求平均)
对该平均值再求3个月滚动平均,命名为 oni
绘制3个月滚动平均随时间的变化
对正、负值进行填色
画出 0.5,0, -0.5 °C 三条横线,其中 0 为实线,其它两条为虚线
ax.axhline()修改坐标轴的标题
# 你的代码
对厄尔尼诺/拉尼娜进行聚合分析 Composite analysis
聚合分析是指对性质相似的事件进行归类、取平均,以便归纳同类型事件的特性。此处我们来看厄尔尼诺和拉尼娜现象对应的海温异常分布。
# 创建一个新的 dataarray,其形状和 sst 一样,但是数据类型是分类(category)
# oni 是你在作业2中创建的Nino3.4指数

nino34 = xr.full_like(oni, 'none', dtype='U4')
nino34[oni >= 0.5] = 'nino'
nino34[oni <= -0.5] = 'nina'
nino34
作业3
根据上面的
nino3.4,对sst_anom进行分类,并求平均分别画出厄尔尼诺和拉尼娜时的
sst_anom空间分布图。注意:要按照作业1的美观要求进行绘制。
# 你的代码
