Cartopy 地图绘制(1)
Contents
Cartopy 地图绘制(1)

Cartography Python
主讲人:李显祥
大气科学学院
import xarray as xr
import numpy as np
import matplotlib.pyplot as plt
import cartopy.crs as ccrs
import cartopy.feature as cfeat

%matplotlib inline
import cartopy

print(cartopy.__version__)
0.18.0
cartopy.config.values()
dict_values(['', '/Users/lixx/.local/share/cartopy', '/opt/miniconda3/lib/python3.7/site-packages/cartopy/data', {('shapefiles', 'natural_earth'): <cartopy.io.shapereader.NEShpDownloader object at 0x7fcec154a790>, ('shapefiles', 'gshhs'): <cartopy.io.shapereader.GSHHSShpDownloader object at 0x7fcec1633050>}])
Cartopy 用于基于地图的数据可视化。它依赖于以下包:
matplotlibnumpyproj4shapely
它取代 Basemap,但是还没有完全实现 Basemap 的所有功能。
投影 Projection
 |  |
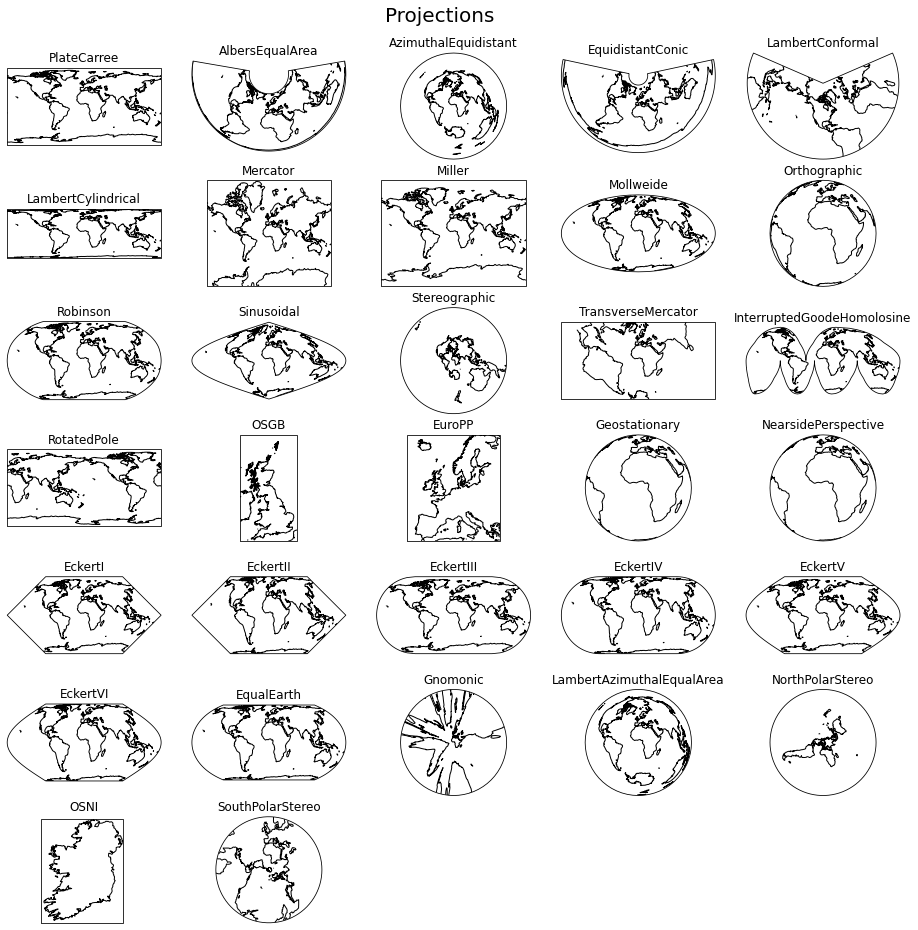
为了将地球(或者地球的一部分)画到平面上(纸上或者屏幕上),我们需要投影(Projections)。
Cartopy通过crs子模块提供了很多不同的投影法。Cartopy依赖于matplotlib, 每一种投影方法会创建matplotlibAxes(或者AxesSubplot)用来绘制数据。投影创建的
Axes是一个cartopy.mpl.geoaxes.GeoAxes对象。 这个Axes子类重载(override)了matplotlib的一些方法,并添加了一些非常有用的方法,尤其是用来绘制地图的方法。
fig = plt.figure(figsize=(16,16))
fig.suptitle('Projections', fontsize=20, y=0.92)

projections = {'PlateCarree': ccrs.PlateCarree(), 'AlbersEqualArea': ccrs.AlbersEqualArea(),
               'AzimuthalEquidistant': ccrs.AzimuthalEquidistant(), 'EquidistantConic': ccrs.EquidistantConic(),
               'LambertConformal': ccrs.LambertConformal(), 'LambertCylindrical': ccrs.LambertCylindrical(),
               'Mercator': ccrs.Mercator(), 'Miller': ccrs.Miller(), 'Mollweide': ccrs.Mollweide(),
               'Orthographic': ccrs.Orthographic(), 'Robinson': ccrs.Robinson(), 'Sinusoidal': ccrs.Sinusoidal(),
               'Stereographic': ccrs.Stereographic(), 'TransverseMercator': ccrs.TransverseMercator(),
               'InterruptedGoodeHomolosine': ccrs.InterruptedGoodeHomolosine(),
               'RotatedPole': ccrs.RotatedPole(), 'OSGB': ccrs.OSGB(), 'EuroPP': ccrs.EuroPP(),
               'Geostationary': ccrs.Geostationary(), 'NearsidePerspective': ccrs.NearsidePerspective(),
               'EckertI': ccrs.EckertI(), 'EckertII': ccrs.EckertII(), 'EckertIII': ccrs.EckertIII(),
               'EckertIV': ccrs.EckertIV(), 'EckertV': ccrs.EckertV(), 'EckertVI': ccrs.EckertVI(),
               'EqualEarth': ccrs.EqualEarth(), 'Gnomonic': ccrs.Gnomonic(),
               'LambertAzimuthalEqualArea': ccrs.LambertAzimuthalEqualArea(),
               'NorthPolarStereo': ccrs.NorthPolarStereo(), 'OSNI': ccrs.OSNI(),
               'SouthPolarStereo': ccrs.SouthPolarStereo()} #, 'Geodetic': ccrs.Geodetic()}

for index, projection in enumerate(projections.items()):
    ax = fig.add_subplot(7, 5, index+1, projection=projection[1])
    ax.set_global()
    ax.coastlines()
    ax.set_title(projection[0])
/opt/miniconda3/lib/python3.7/site-packages/ipykernel_launcher.py:9: UserWarning: The default value for the *approx* keyword argument to TransverseMercator will change from True to False after 0.18.
  if __name__ == '__main__':
/opt/miniconda3/lib/python3.7/site-packages/ipykernel_launcher.py:11: UserWarning: The default value for the *approx* keyword argument to OSGB will change from True to False after 0.18.
  # This is added back by InteractiveShellApp.init_path()
/opt/miniconda3/lib/python3.7/site-packages/ipykernel_launcher.py:17: UserWarning: The default value for the *approx* keyword argument to OSNI will change from True to False after 0.18.
/opt/miniconda3/lib/python3.7/site-packages/cartopy/mpl/feature_artist.py:154: UserWarning: Unable to determine extent. Defaulting to global.
  warnings.warn('Unable to determine extent. Defaulting to global.')
# Make sure the figure is a decent size when plotted.
fig = plt.figure(figsize=(12, 12))

ax1 = fig.add_subplot(2, 2, 1, projection=ccrs.PlateCarree())
ax1.coastlines()
ax1.set_title('PlateCarree')

ax2 = fig.add_subplot(2, 2, 2, projection=ccrs.Sinusoidal())
ax2.coastlines()
ax2.set_title('Sinusoidal')

ax1 = fig.add_subplot(2, 2, 3, projection=ccrs.NorthPolarStereo())
ax1.coastlines()
ax1.set_title('NorthPolarStereo')

ax2 = fig.add_subplot(2, 2, 4, projection=ccrs.Geostationary())
ax2.coastlines()
ax2.set_title('Geostationary')
Text(0.5, 1.0, 'Geostationary')
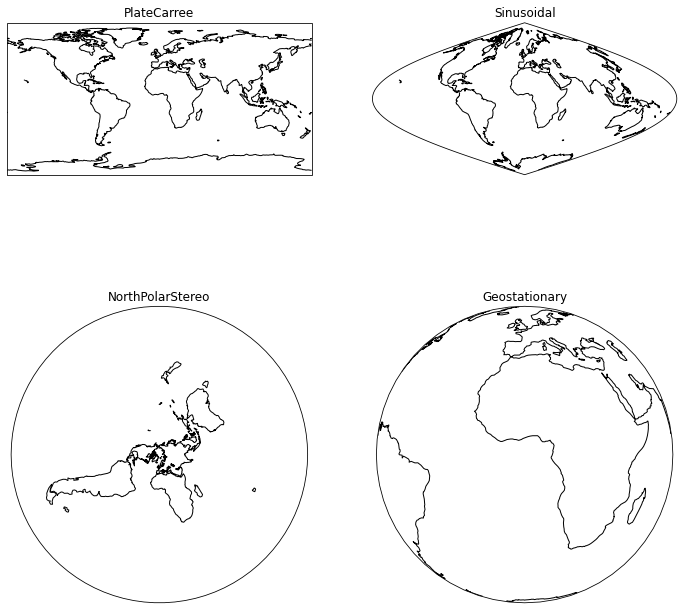
三维的地球无法完美地投影到平面上。
某些实际地理特性无法保持:
Area
Shape
Direction
Distance
Scale
All models (map projections) are wrong, but some are useful. - Phileas Elson (SciPy 2018)
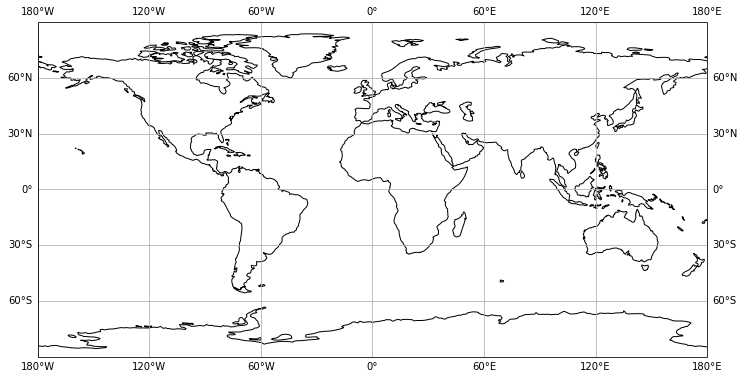
添加经纬度标签
from cartopy.mpl.gridliner import LONGITUDE_FORMATTER, LATITUDE_FORMATTER

# latitude and longitude with east and west, etc.
plt.figure(figsize=(12, 8))
m = plt.axes(projection=ccrs.PlateCarree())
grid_lines = m.gridlines(draw_labels=True)
grid_lines.xformatter = LONGITUDE_FORMATTER
grid_lines.yformatter = LATITUDE_FORMATTER
m.coastlines('110m') # 50m, 10m
<cartopy.mpl.feature_artist.FeatureArtist at 0x7fcec2c63090>
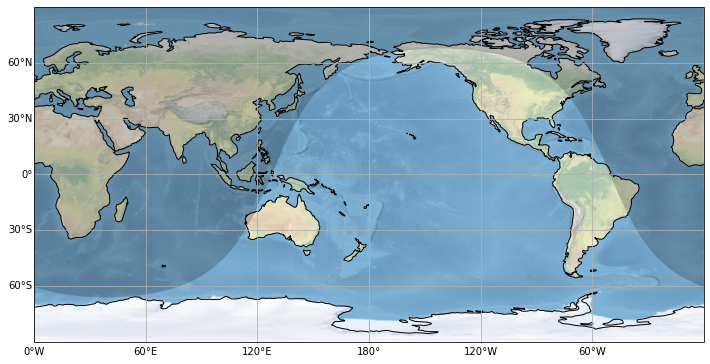
我们可以改变地图的中心点,还可以用 stock_img 来叠加一个默认的背景图, 用 nightshade 来区分夜晚/白天
from cartopy.mpl.ticker import LongitudeFormatter, LatitudeFormatter
import matplotlib.ticker as mticker
import datetime
from cartopy.feature.nightshade import Nightshade

date = datetime.datetime.now()
plt.figure(figsize=(12, 8))
m = plt.axes(projection=ccrs.PlateCarree(central_longitude=180))
grid_lines = m.gridlines(draw_labels=True)
#grid_lines.xlabels_top = False     # v0.18 改变
grid_lines.top_labels = False
#grid_lines.ylabels_right = False   # v0.18 改变
grid_lines.right_labels = False
#grid_lines.xlocator = mticker.FixedLocator([0,60,120,180,-180,-120,-60])
grid_lines.xformatter = LongitudeFormatter(zero_direction_label=True)
grid_lines.yformatter = LatitudeFormatter()
m.coastlines()
m.stock_img()
m.add_feature(Nightshade(date, alpha=0.2))
<cartopy.mpl.feature_artist.FeatureArtist at 0x7fcec39cf4d0>
地图特性 The Feature Interface
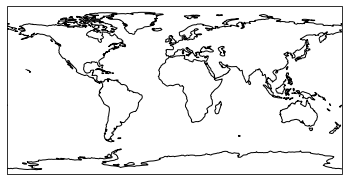
Cartopy 可以通过地图特性来添加海岸线、海洋、陆地、河流等信息。
# Add coastlines to the map.
ax = plt.axes(projection=ccrs.PlateCarree())
ax.add_feature(cfeat.COASTLINE)  # Equivalent to `ax.coastlines()`
<cartopy.mpl.feature_artist.FeatureArtist at 0x7fcec39ee090>
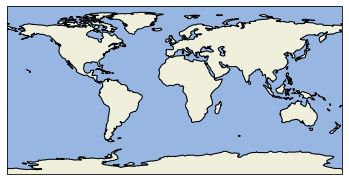
# Add land and ocean features, that come with preset face colours.
ax = plt.axes(projection=ccrs.PlateCarree())
ax.add_feature(cfeat.COASTLINE)
ax.add_feature(cfeat.LAND)
ax.add_feature(cfeat.OCEAN)
<cartopy.mpl.feature_artist.FeatureArtist at 0x7fcec2e03190>
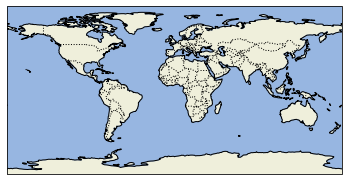
# Add country borders.
ax = plt.axes(projection=ccrs.PlateCarree())
ax.add_feature(cfeat.COASTLINE)
ax.add_feature(cfeat.LAND)
ax.add_feature(cfeat.OCEAN)
ax.add_feature(cfeat.BORDERS, linestyle=':')
<cartopy.mpl.feature_artist.FeatureArtist at 0x7fcec38c4d10>
# And finally, add lakes and rivers.
plt.figure(figsize=(12,5))
for i_subplot in (121, 122):
    ax = plt.subplot(i_subplot, projection=ccrs.PlateCarree())
    ax.add_feature(cfeat.COASTLINE)
    ax.add_feature(cfeat.LAND)
    ax.add_feature(cfeat.OCEAN)
    ax.add_feature(cfeat.BORDERS, linestyle=':')
    ax.add_feature(cfeat.LAKES, alpha=0.5)
    ax.add_feature(cfeat.RIVERS)
    if i_subplot == 122:
        #ax.set_extent((-175, -90, 40, 70))
        ax.set_extent((70, 140, 15, 50))

转换参考系 Transforming data
为了绘制地理数据,我们必须在标准的 matplotlib 绘图函数中指定transform 参数,来告诉绘图程序所绘制数据的投影方法. 所以
transform 的值应该是所绘制数据的原始投影方法。
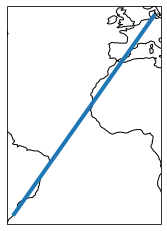
首先我们在 PlateCarree 投影里绘制一条线.
ax = plt.axes(projection=ccrs.PlateCarree())
ax.coastlines()
x0, y0 = -50, -30 #104, 1.3
x1, y1 = 10, 55 #113, 22
plt.plot([x0, x1], [y0, y1], linewidth=4)
[<matplotlib.lines.Line2D at 0x7fcec2d55250>]
然后在 EquidistantConic 投影里绘制同一条线。
proj = ccrs.EquidistantConic()

ax = plt.axes(projection=proj)
ax.coastlines()
plt.plot([x0, x1], [y0, y1], linewidth=4)
[<matplotlib.lines.Line2D at 0x7fcec38dba90>]

这条线 并不是 我们所要的。
我们设置坐标系使用 Equidistant Conic 投影, 但是并没有告诉 Cartopy 数据所用的是 PlateCarree 投影.
为此, 我们传递 transform 关键词给 plt.plot 函数:
ax = plt.axes(projection=proj)
ax.coastlines()
plt.plot([x0, x1], [y0, y1], linewidth=4, transform=ccrs.PlateCarree())
[<matplotlib.lines.Line2D at 0x7fcec22c2250>]
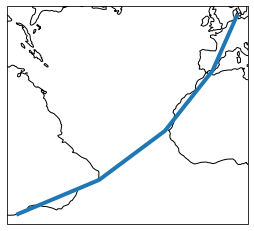
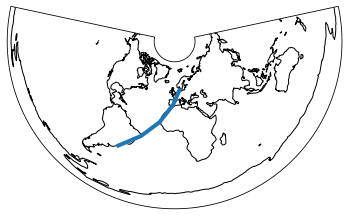
注意到绘制的线是弯曲的:它 在定义它的坐标系里 是直的, 而在不同的坐标系(投影)里面变成了曲线。
同时要注意, 除非我们调用 set_extent 来设定地图的范围, 否则默认地图只显示我们绘制数据的地方。
我们可以用 set_global 方法来绘制全球地图,这样我们就可以看到这条线是从哪里到哪里了:
ax = plt.axes(projection=proj)
ax.coastlines()
ax.set_global()
plt.plot([x0, x1], [y0, y1], linewidth=4, transform=ccrs.PlateCarree())
[<matplotlib.lines.Line2D at 0x7fcec1bb3b50>]
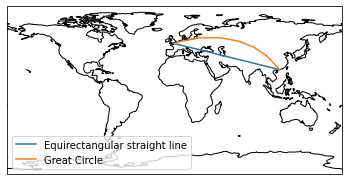
例子:珠海到伦敦
# create some test data
zhuhai = dict(lon=113, lat=22)
london = dict(lon=0, lat=50)
lons = [zhuhai['lon'], london['lon']]
lats = [zhuhai['lat'], london['lat']]

ax = plt.axes(projection=ccrs.PlateCarree())
ax.plot(lons, lats, label='Equirectangular straight line') #, transform=ccrs.PlateCarree())
ax.plot(lons, lats, label='Great Circle', transform=ccrs.Geodetic())
ax.coastlines()
ax.legend()
ax.set_global()
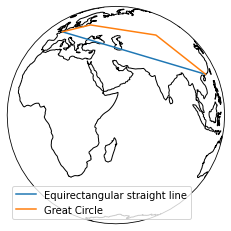
ax = plt.axes(projection=ccrs.Orthographic(central_longitude=50))
ax.plot(lons, lats, label='Equirectangular straight line', transform=ccrs.PlateCarree())
ax.plot(lons, lats, label='Great Circle', transform=ccrs.Geodetic())
ax.coastlines()
ax.legend()
ax.set_global()
绘制二维 (Raster) 数据
import numpy as np
lon = np.linspace(-80, 80, 25)
lat = np.linspace(-20, 20, 25)
lon2d, lat2d = np.meshgrid(lon, lat)
data = np.cos(np.deg2rad(lat2d) * 4) + np.sin(np.deg2rad(lon2d) * 4)
plt.contourf(lon2d, lat2d, data)
<matplotlib.contour.QuadContourSet at 0x7fcec1f2a350>
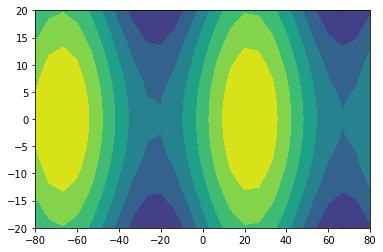
现在我们创建一个 PlateCarree 投影的图, 不使用 transform 关键词来绘制数据. 它凑巧可以工作,因为 PlateCarree 是lat / lon 数据的最简单投影方法.
ax = plt.axes(projection=ccrs.PlateCarree())
ax.set_global()
ax.coastlines()
ax.contourf(lon, lat, data)
<cartopy.mpl.contour.GeoContourSet at 0x7fcec200e550>
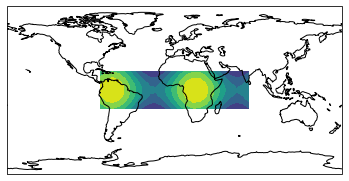
但是,当我们在另一个不同的投影方法下做同样的事情,我们可能得到错误的结果:
#projection = ccrs.RotatedPole(pole_longitude=-177.5, pole_latitude=37.5)
projection = ccrs.Orthographic()
ax = plt.axes(projection=projection)
ax.set_global()
ax.coastlines()
ax.contourf(lon, lat, data)
<cartopy.mpl.contour.GeoContourSet at 0x7fcec22dcc90>
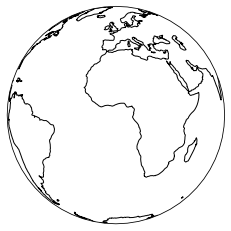
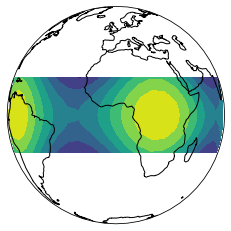
要改正它,我们需要给 contourf 传递正确的 transform 参数:
#projection = ccrs.RotatedPole(pole_longitude=-177.5, pole_latitude=37.5)
projection = ccrs.Orthographic()
ax = plt.axes(projection=projection)
ax.set_global()
ax.coastlines()
ax.contourf(lon, lat, data, transform=ccrs.PlateCarree())
<cartopy.mpl.contour.GeoContourSet at 0x7fcec1af9d10>
与 xarray结合绘图
import os
import matplotlib.pyplot as plt
import xarray as xr
import numpy as np

from cartopy import config
import cartopy.crs as ccrs


# get the path of the file. It can be found in the repo data directory.
fname = os.path.join(config["repo_data_dir"],
                     'netcdf', 'HadISST1_SST_update.nc')

dataset = xr.open_dataset(fname)
#from netCDF4 import Dataset as netcdf_dataset
#dataset = netcdf_dataset(fname)
#sst = dataset.variables['sst'][0, :, :]
#lats = dataset.variables['lat'][:]
#lons = dataset.variables['lon'][:]

#ax = plt.axes(projection=ccrs.PlateCarree())

#plt.contourf(lons, lats, sst, 60,
#             transform=ccrs.PlateCarree())

#ax.coastlines()
/opt/miniconda3/lib/python3.7/site-packages/xarray/coding/times.py:83: SerializationWarning: Ambiguous reference date string: 1-1-1 00:00:0.0. The first value is assumed to be the year hence will be padded with zeros to remove the ambiguity (the padded reference date string is: 0001-1-1 00:00:0.0). To remove this message, remove the ambiguity by padding your reference date strings with zeros.
  warnings.warn(warning_msg, SerializationWarning)
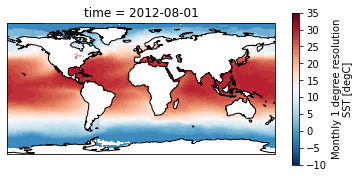
sst = dataset.sst.isel(time=0)

ax = plt.axes(projection=ccrs.PlateCarree())  # 非常关键的语句
sst.plot.contourf(ax=ax,vmin=-10,vmax=35,levels=46,cmap='RdBu_r',
                  transform=ccrs.PlateCarree(),cbar_kwargs={'shrink': 0.7})
ax.coastlines()
<cartopy.mpl.feature_artist.FeatureArtist at 0x7fcec1bd51d0>
# add_cyclic example
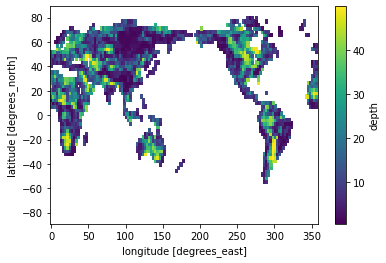
ds = xr.open_dataset("example.nc")
ds['depth'].plot()
<matplotlib.collections.QuadMesh at 0x7fcea73b1390>
ds
<xarray.Dataset>
Dimensions:  (lat: 64, lon: 128)
Coordinates:
  * lon      (lon) float64 0.0 2.812 5.625 8.438 ... 348.8 351.6 354.4 357.2
  * lat      (lat) float64 -87.86 -85.1 -82.31 -79.53 ... 79.53 82.31 85.1 87.86
Data variables:
depth (lat, lon) float64 nan nan nan nan nan nan ... nan nan nan nan nan- lat: 64
- lon: 128
- lon(lon)float640.0 2.812 5.625 ... 354.4 357.2
- standard_name :
- longitude
- long_name :
- longitude
- units :
- degrees_east
- axis :
- X
array([ 0. , 2.8125, 5.625 , 8.4375, 11.25 , 14.0625, 16.875 , 19.6875, 22.5 , 25.3125, 28.125 , 30.9375, 33.75 , 36.5625, 39.375 , 42.1875, 45. , 47.8125, 50.625 , 53.4375, 56.25 , 59.0625, 61.875 , 64.6875, 67.5 , 70.3125, 73.125 , 75.9375, 78.75 , 81.5625, 84.375 , 87.1875, 90. , 92.8125, 95.625 , 98.4375, 101.25 , 104.0625, 106.875 , 109.6875, 112.5 , 115.3125, 118.125 , 120.9375, 123.75 , 126.5625, 129.375 , 132.1875, 135. , 137.8125, 140.625 , 143.4375, 146.25 , 149.0625, 151.875 , 154.6875, 157.5 , 160.3125, 163.125 , 165.9375, 168.75 , 171.5625, 174.375 , 177.1875, 180. , 182.8125, 185.625 , 188.4375, 191.25 , 194.0625, 196.875 , 199.6875, 202.5 , 205.3125, 208.125 , 210.9375, 213.75 , 216.5625, 219.375 , 222.1875, 225. , 227.8125, 230.625 , 233.4375, 236.25 , 239.0625, 241.875 , 244.6875, 247.5 , 250.3125, 253.125 , 255.9375, 258.75 , 261.5625, 264.375 , 267.1875, 270. , 272.8125, 275.625 , 278.4375, 281.25 , 284.0625, 286.875 , 289.6875, 292.5 , 295.3125, 298.125 , 300.9375, 303.75 , 306.5625, 309.375 , 312.1875, 315. , 317.8125, 320.625 , 323.4375, 326.25 , 329.0625, 331.875 , 334.6875, 337.5 , 340.3125, 343.125 , 345.9375, 348.75 , 351.5625, 354.375 , 357.1875]) - lat(lat)float64-87.86 -85.1 -82.31 ... 85.1 87.86
- standard_name :
- latitude
- long_name :
- latitude
- units :
- degrees_north
- axis :
- Y
array([-87.863614, -85.096348, -82.31274 , -79.525439, -76.736738, -73.947359,
       -71.157602, -68.367612, -65.577469, -62.78722 , -59.996894, -57.206511,
       -54.416085, -51.625625, -48.835138, -46.04463 , -43.254104, -40.463563,
       -37.67301 , -34.882447, -32.091876, -29.301298, -26.510713, -23.720124,
       -20.92953 , -18.138933, -15.348332, -12.55773 ,  -9.767125,  -6.976519,
        -4.185912,  -1.395304,   1.395304,   4.185912,   6.976519,   9.767125,
        12.55773 ,  15.348332,  18.138933,  20.92953 ,  23.720124,  26.510713,
        29.301298,  32.091876,  34.882447,  37.67301 ,  40.463563,  43.254104,
        46.04463 ,  48.835138,  51.625625,  54.416085,  57.206511,  59.996894,
        62.78722 ,  65.577469,  68.367612,  71.157602,  73.947359,  76.736738,
        79.525439,  82.31274 ,  85.096348,  87.863614])
- depth(lat, lon)float64...
array([[nan, nan, nan, ..., nan, nan, nan],
       [nan, nan, nan, ..., nan, nan, nan],
       [nan, nan, nan, ..., nan, nan, nan],
       ...,
       [nan, nan, nan, ..., nan, nan, nan],
       [nan, nan, nan, ..., nan, nan, nan],
       [nan, nan, nan, ..., nan, nan, nan]])
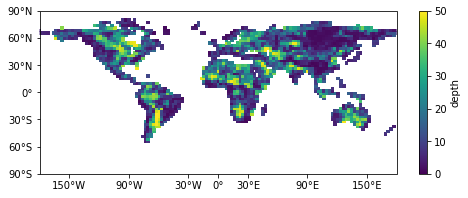
from cartopy.mpl.ticker import LongitudeFormatter, LatitudeFormatter

proj = ccrs.PlateCarree()

fig = plt.figure(figsize=(8,3))
ax = fig.add_subplot(111, projection=proj, aspect='auto')

pc = ax.pcolormesh(ds.lon, ds.lat, ds.depth, vmin=0, vmax=50)
cb = plt.colorbar(pc, ax=ax, orientation='vertical')
cb.set_label(ds.depth.name)

ax.set_global()
ax.set_xticks([-150, -90, -30, 0, 30, 90, 150], crs=proj)
ax.set_yticks([-90, -60, -30, 0, 30, 60, 90], crs=proj)
ax.xaxis.set_major_formatter(LongitudeFormatter())
ax.yaxis.set_major_formatter(LatitudeFormatter())
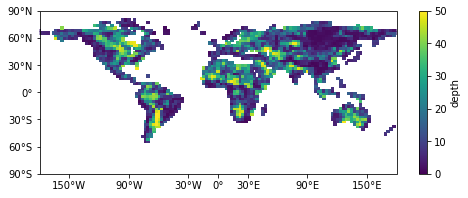
from cartopy.util import add_cyclic_point

data = ds['depth']
lon = ds.coords['lon']

print("Original shape -", data.shape)
lon_idx = data.dims.index('lon')
wrap_data, wrap_lon = add_cyclic_point(data.values, coord=lon, axis=lon_idx)
print("New shape -", wrap_data.shape)
Original shape - (64, 128)
New shape - (64, 129)
fig = plt.figure(figsize=(8,3))
ax = fig.add_subplot(111, projection=proj, aspect='auto')

pc = ax.pcolormesh(wrap_lon, ds.lat, wrap_data, vmin=0, vmax=50)
cb = plt.colorbar(pc, ax=ax, orientation='vertical')
cb.set_label(ds.depth.name)

ax.set_global()
ax.set_xticks([-150, -90, -30, 0, 30, 90, 150], crs=proj)
ax.set_yticks([-90, -60, -30, 0, 30, 60, 90], crs=proj)
ax.xaxis.set_major_formatter(LongitudeFormatter())
ax.yaxis.set_major_formatter(LatitudeFormatter())
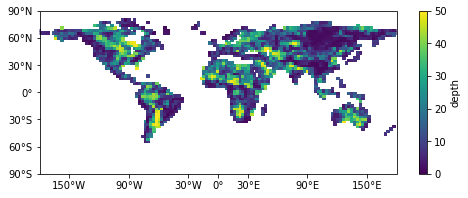
另一种(更好的)解决方案
之前我们学过:xarray.dataset.assign_coords 可以用来改变坐标值。
ds_new = ds.assign_coords({'lon':(((ds.lon+180)%360)-180)})
# 或者
# ds_new = ds.assign_coords(lon = (((ds.lon+180)%360)-180))
ds_new
<xarray.Dataset>
Dimensions:  (lat: 64, lon: 128)
Coordinates:
  * lon      (lon) float64 0.0 2.812 5.625 8.438 ... -11.25 -8.438 -5.625 -2.812
  * lat      (lat) float64 -87.86 -85.1 -82.31 -79.53 ... 79.53 82.31 85.1 87.86
Data variables:
depth (lat, lon) float64 nan nan nan nan nan nan ... nan nan nan nan nan- lat: 64
- lon: 128
- lon(lon)float640.0 2.812 5.625 ... -5.625 -2.812
array([ 0. , 2.8125, 5.625 , 8.4375, 11.25 , 14.0625, 16.875 , 19.6875, 22.5 , 25.3125, 28.125 , 30.9375, 33.75 , 36.5625, 39.375 , 42.1875, 45. , 47.8125, 50.625 , 53.4375, 56.25 , 59.0625, 61.875 , 64.6875, 67.5 , 70.3125, 73.125 , 75.9375, 78.75 , 81.5625, 84.375 , 87.1875, 90. , 92.8125, 95.625 , 98.4375, 101.25 , 104.0625, 106.875 , 109.6875, 112.5 , 115.3125, 118.125 , 120.9375, 123.75 , 126.5625, 129.375 , 132.1875, 135. , 137.8125, 140.625 , 143.4375, 146.25 , 149.0625, 151.875 , 154.6875, 157.5 , 160.3125, 163.125 , 165.9375, 168.75 , 171.5625, 174.375 , 177.1875, -180. , -177.1875, -174.375 , -171.5625, -168.75 , -165.9375, -163.125 , -160.3125, -157.5 , -154.6875, -151.875 , -149.0625, -146.25 , -143.4375, -140.625 , -137.8125, -135. , -132.1875, -129.375 , -126.5625, -123.75 , -120.9375, -118.125 , -115.3125, -112.5 , -109.6875, -106.875 , -104.0625, -101.25 , -98.4375, -95.625 , -92.8125, -90. , -87.1875, -84.375 , -81.5625, -78.75 , -75.9375, -73.125 , -70.3125, -67.5 , -64.6875, -61.875 , -59.0625, -56.25 , -53.4375, -50.625 , -47.8125, -45. , -42.1875, -39.375 , -36.5625, -33.75 , -30.9375, -28.125 , -25.3125, -22.5 , -19.6875, -16.875 , -14.0625, -11.25 , -8.4375, -5.625 , -2.8125]) - lat(lat)float64-87.86 -85.1 -82.31 ... 85.1 87.86
- standard_name :
- latitude
- long_name :
- latitude
- units :
- degrees_north
- axis :
- Y
array([-87.863614, -85.096348, -82.31274 , -79.525439, -76.736738, -73.947359,
       -71.157602, -68.367612, -65.577469, -62.78722 , -59.996894, -57.206511,
       -54.416085, -51.625625, -48.835138, -46.04463 , -43.254104, -40.463563,
       -37.67301 , -34.882447, -32.091876, -29.301298, -26.510713, -23.720124,
       -20.92953 , -18.138933, -15.348332, -12.55773 ,  -9.767125,  -6.976519,
        -4.185912,  -1.395304,   1.395304,   4.185912,   6.976519,   9.767125,
        12.55773 ,  15.348332,  18.138933,  20.92953 ,  23.720124,  26.510713,
        29.301298,  32.091876,  34.882447,  37.67301 ,  40.463563,  43.254104,
        46.04463 ,  48.835138,  51.625625,  54.416085,  57.206511,  59.996894,
        62.78722 ,  65.577469,  68.367612,  71.157602,  73.947359,  76.736738,
        79.525439,  82.31274 ,  85.096348,  87.863614])
- depth(lat, lon)float64nan nan nan nan ... nan nan nan nan
array([[nan, nan, nan, ..., nan, nan, nan],
       [nan, nan, nan, ..., nan, nan, nan],
       [nan, nan, nan, ..., nan, nan, nan],
       ...,
       [nan, nan, nan, ..., nan, nan, nan],
       [nan, nan, nan, ..., nan, nan, nan],
       [nan, nan, nan, ..., nan, nan, nan]])
可以进一步用 sortby 来把坐标换成我们习惯的顺序,但并不是必须的。
ds_new = ds.assign_coords({'lon':(((ds.lon+180)%360)-180)}).sortby('lon')
ds_new
<xarray.Dataset>
Dimensions:  (lat: 64, lon: 128)
Coordinates:
  * lon      (lon) float64 -180.0 -177.2 -174.4 -171.6 ... 171.6 174.4 177.2
  * lat      (lat) float64 -87.86 -85.1 -82.31 -79.53 ... 79.53 82.31 85.1 87.86
Data variables:
depth (lat, lon) float64 nan nan nan nan nan nan ... nan nan nan nan nan- lat: 64
- lon: 128
- lon(lon)float64-180.0 -177.2 ... 174.4 177.2
array([-180. , -177.1875, -174.375 , -171.5625, -168.75 , -165.9375, -163.125 , -160.3125, -157.5 , -154.6875, -151.875 , -149.0625, -146.25 , -143.4375, -140.625 , -137.8125, -135. , -132.1875, -129.375 , -126.5625, -123.75 , -120.9375, -118.125 , -115.3125, -112.5 , -109.6875, -106.875 , -104.0625, -101.25 , -98.4375, -95.625 , -92.8125, -90. , -87.1875, -84.375 , -81.5625, -78.75 , -75.9375, -73.125 , -70.3125, -67.5 , -64.6875, -61.875 , -59.0625, -56.25 , -53.4375, -50.625 , -47.8125, -45. , -42.1875, -39.375 , -36.5625, -33.75 , -30.9375, -28.125 , -25.3125, -22.5 , -19.6875, -16.875 , -14.0625, -11.25 , -8.4375, -5.625 , -2.8125, 0. , 2.8125, 5.625 , 8.4375, 11.25 , 14.0625, 16.875 , 19.6875, 22.5 , 25.3125, 28.125 , 30.9375, 33.75 , 36.5625, 39.375 , 42.1875, 45. , 47.8125, 50.625 , 53.4375, 56.25 , 59.0625, 61.875 , 64.6875, 67.5 , 70.3125, 73.125 , 75.9375, 78.75 , 81.5625, 84.375 , 87.1875, 90. , 92.8125, 95.625 , 98.4375, 101.25 , 104.0625, 106.875 , 109.6875, 112.5 , 115.3125, 118.125 , 120.9375, 123.75 , 126.5625, 129.375 , 132.1875, 135. , 137.8125, 140.625 , 143.4375, 146.25 , 149.0625, 151.875 , 154.6875, 157.5 , 160.3125, 163.125 , 165.9375, 168.75 , 171.5625, 174.375 , 177.1875]) - lat(lat)float64-87.86 -85.1 -82.31 ... 85.1 87.86
- standard_name :
- latitude
- long_name :
- latitude
- units :
- degrees_north
- axis :
- Y
array([-87.863614, -85.096348, -82.31274 , -79.525439, -76.736738, -73.947359,
       -71.157602, -68.367612, -65.577469, -62.78722 , -59.996894, -57.206511,
       -54.416085, -51.625625, -48.835138, -46.04463 , -43.254104, -40.463563,
       -37.67301 , -34.882447, -32.091876, -29.301298, -26.510713, -23.720124,
       -20.92953 , -18.138933, -15.348332, -12.55773 ,  -9.767125,  -6.976519,
        -4.185912,  -1.395304,   1.395304,   4.185912,   6.976519,   9.767125,
        12.55773 ,  15.348332,  18.138933,  20.92953 ,  23.720124,  26.510713,
        29.301298,  32.091876,  34.882447,  37.67301 ,  40.463563,  43.254104,
        46.04463 ,  48.835138,  51.625625,  54.416085,  57.206511,  59.996894,
        62.78722 ,  65.577469,  68.367612,  71.157602,  73.947359,  76.736738,
        79.525439,  82.31274 ,  85.096348,  87.863614])
- depth(lat, lon)float64nan nan nan nan ... nan nan nan nan
array([[nan, nan, nan, ..., nan, nan, nan],
       [nan, nan, nan, ..., nan, nan, nan],
       [nan, nan, nan, ..., nan, nan, nan],
       ...,
       [nan, nan, nan, ..., nan, nan, nan],
       [nan, nan, nan, ..., nan, nan, nan],
       [nan, nan, nan, ..., nan, nan, nan]])
fig = plt.figure(figsize=(8,3))
ax = fig.add_subplot(111, projection=proj, aspect='auto')

ds_new.depth.plot.pcolormesh(ax=ax,vmin=0,vmax=50)

ax.set_global()
ax.set_xticks([-150, -90, -30, 0, 30, 90, 150], crs=proj)
ax.set_yticks([-90, -60, -30, 0, 30, 60, 90], crs=proj)
ax.set_xlabel(None)
ax.set_ylabel(None)
ax.xaxis.set_major_formatter(LongitudeFormatter())
ax.yaxis.set_major_formatter(LatitudeFormatter())
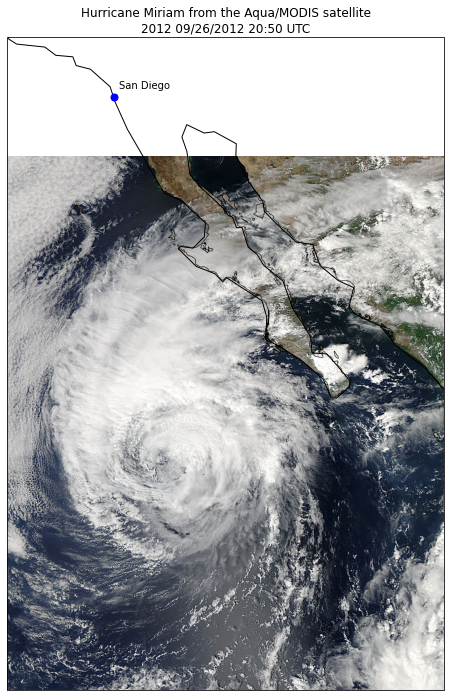
展示卫星图像
import os
import matplotlib.pyplot as plt

from cartopy import config
import cartopy.crs as ccrs


fig = plt.figure(figsize=(8, 12))

# get the path of the file. It can be found in the repo data directory.
fname = os.path.join(config["repo_data_dir"],
                     'raster', 'sample', 'Miriam.A2012270.2050.2km.jpg'
                     )
img_extent = (-120.67660000000001, -106.32104523100001, 13.2301484511245, 30.766899999999502)
img = plt.imread(fname)

ax = plt.axes(projection=ccrs.PlateCarree())
plt.title('Hurricane Miriam from the Aqua/MODIS satellite\n'
          '2012 09/26/2012 20:50 UTC')

# set a margin around the data
ax.set_xmargin(0.05)
ax.set_ymargin(0.10)

# add the image. Because this image was a tif, the "origin" of the image is in the
# upper left corner
ax.imshow(img, origin='upper', extent=img_extent, transform=ccrs.PlateCarree())
ax.coastlines(resolution='110m', color='black', linewidth=1)

# mark a known place to help us geo-locate ourselves
ax.plot(-117.1625, 32.715, 'bo', markersize=7, transform=ccrs.Geodetic())
ax.text(-117, 33, 'San Diego', transform=ccrs.Geodetic())
Text(-117, 33, 'San Diego')
风云卫星图像
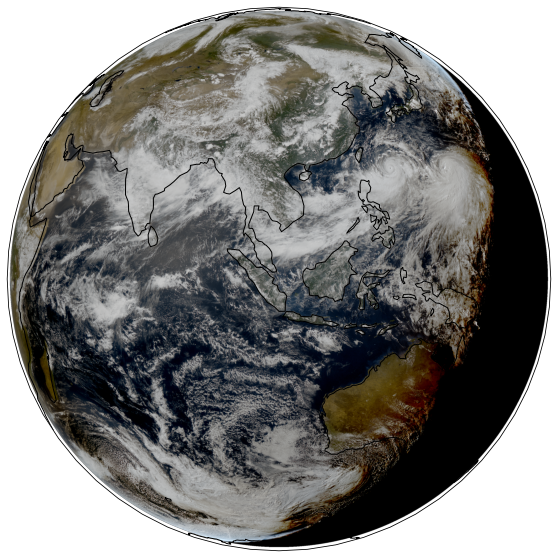
风云4A 是我国第二代地球同步卫星。根据 http://fy4.nsmc.org.cn/portal/cn/operation/status.html, 风云4A 卫星高度为 35755 km,中心经度在104.7°E,我们可以据此构建一个同步卫星投影方法,从而将卫星图像叠加到采用任何投影的地图上去。
fy_proj = ccrs.Geostationary(satellite_height=35755000,central_longitude=104.7)
fy_proj
<cartopy.crs.Geostationary object at 0x7fcec2171b30>
img_fname = 'FY4A_201908070800_composite_true_color.png'
img_extent = fy_proj.x_limits + fy_proj.y_limits

img = plt.imread(img_fname)
fig = plt.figure(figsize=(10,10))
ax = plt.axes(projection=fy_proj)
ax.set_global()
ax.coastlines()

ax.imshow(img, transform=fy_proj,extent=img_extent,origin='upper')
<matplotlib.image.AxesImage at 0x7fcea73d07d0>
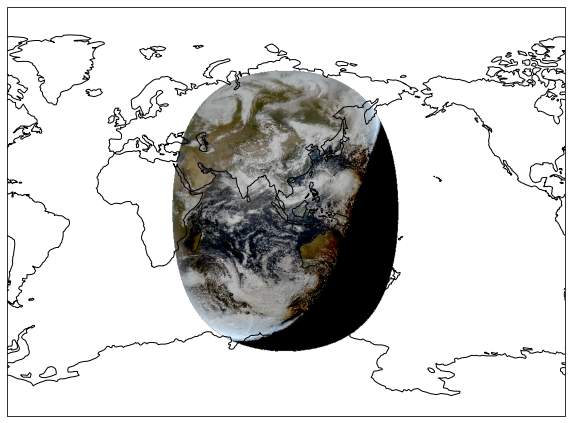
我们可以将此图像投影到其它地图中。
fig = plt.figure(figsize=(10,10))
ax = plt.axes(projection=ccrs.Miller(central_longitude=105.))
ax.set_global()
ax.coastlines()

ax.imshow(img, transform=fy_proj,extent=img_extent,origin='upper')
<matplotlib.image.AxesImage at 0x7fcea73b5710>
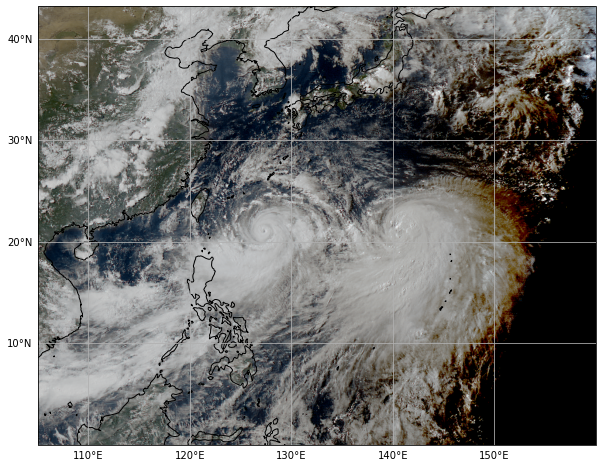
我们放大“双台共舞”的区域来看看 2019-09 超强台风利奇马 和 2019-10 强台风罗莎:
fig = plt.figure(figsize=(10,10))
ax = plt.axes(projection=ccrs.PlateCarree())
ax.coastlines()
ax.set_extent([105,160,0,40])
grid_lines = ax.gridlines(draw_labels=True)
grid_lines.xlabels_top = grid_lines.ylabels_right = False
grid_lines.xformatter = LONGITUDE_FORMATTER
grid_lines.yformatter = LATITUDE_FORMATTER
ax.imshow(img, transform=fy_proj,extent=img_extent,origin='upper')
/opt/miniconda3/lib/python3.7/site-packages/cartopy/mpl/gridliner.py:307: UserWarning: The .xlabels_top attribute is deprecated. Please use .top_labels to toggle visibility instead.
  warnings.warn('The .xlabels_top attribute is deprecated. Please '
/opt/miniconda3/lib/python3.7/site-packages/cartopy/mpl/gridliner.py:343: UserWarning: The .ylabels_right attribute is deprecated. Please use .right_labels to toggle visibility instead.
  warnings.warn('The .ylabels_right attribute is deprecated. Please '
<matplotlib.image.AxesImage at 0x7fcec1d8b390>
我们看看用 SatPy 直接画出来的利奇马:
(参考 https://nbviewer.jupyter.org/github/pytroll/pytroll-examples/blob/master/satpy/FY4A_agri_introduction(zh-CN).ipynb)
Shapefile
shapefile 文件格式:
是数字向量存储格式,用来存储几何形状、位置及相关的信息
shapefile 里存储的地理信息可以用点、线或者多边形(面积)来表示
非拓扑性(topological),即它并不保存相对空间位置信息,例如连接性、相邻性或者面积
最早由 ArcView GIS version 2 于 1990 年代早期引入.
每个 shapefile 包括至少 3 个文件:
.shp: 主文件,包括主要地理数据以及各个形状的记录
.dbf: dBase 数据库文件,存储着每个形状的属性. 它可以让访问空间特性数据变得更快。
.shx: 将 shapefile 的记录组织起来,以供参考.
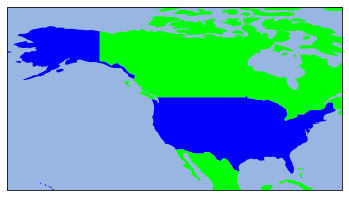
例子: 单独显示某个国家
import cartopy.io.shapereader as shapereader

shpfilename = shapereader.natural_earth(resolution='110m', \
                                      category='cultural', \
                                      name='admin_0_countries')

reader = shapereader.Reader(shpfilename)
countries = reader.records()

# Select the map projection
#----------------------
ax = plt.axes(projection=ccrs.PlateCarree())
ax.add_feature(cfeat.OCEAN)

# Select the area of interest
#-----------------------
ax.set_extent([-170, -65, 20, 70])

for c in countries:
    if c.attributes['ADM0_A3'] == 'USA':
        ax.add_geometries([c.geometry], \
                          ccrs.PlateCarree(), \
                          facecolor=(0, 0, 1), \
                          label=c.attributes['ADM0_A3'])
    else:
        #print(type(c.geometry))
        ax.add_geometries([c.geometry],ccrs.PlateCarree(), \
                          facecolor=(0, 1, 0), \
                          label=c.attributes['ADM0_A3'])
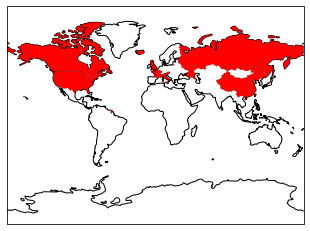
例子:显示多个国家和地区
#import cartopy.feature as cfeat

def area(ax, iso, clr) :
    shp = shapereader.natural_earth(resolution='110m',category='cultural',
                                  name='admin_0_countries')
    reader = shapereader.Reader(shp)
    for n in reader.records() :
        if n.attributes['ADM0_A3'] == iso:
            ax.add_geometries([n.geometry], ccrs.PlateCarree(), facecolor=clr,
                              alpha = 1.00, linewidth =0.15, edgecolor = "black",
                              label=n.attributes['ADM0_A3'])
    return ax

iso3 = ['USA','CAN','RUS','GBR','ISL','FRA','ITA','CHN','TWN','AUT']

ax = plt.axes(projection=ccrs.Miller())
ax.add_feature(cfeat.COASTLINE)
#ax.coastlines()

for n in iso3 :
    area(ax, n, "red")
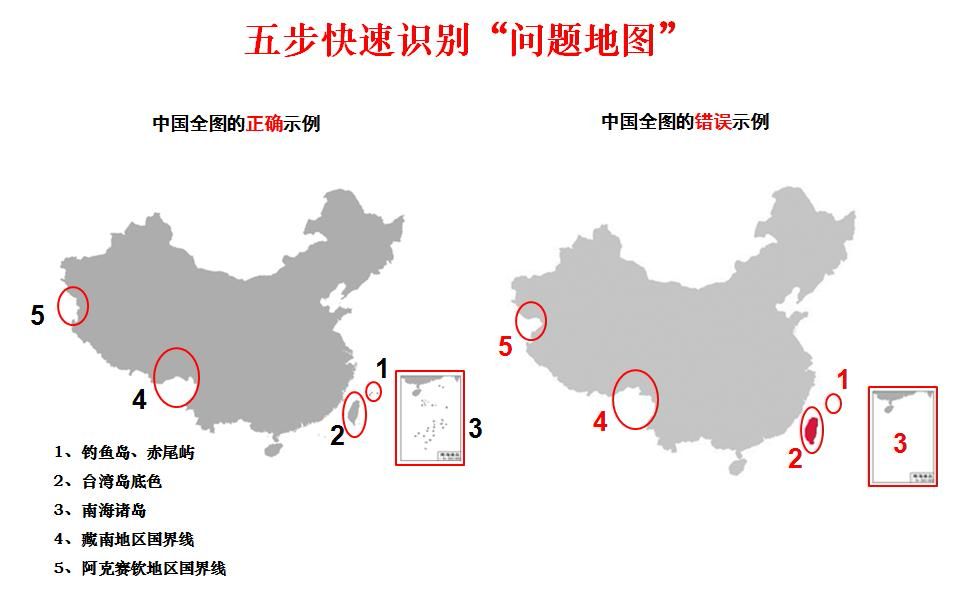
中国地图
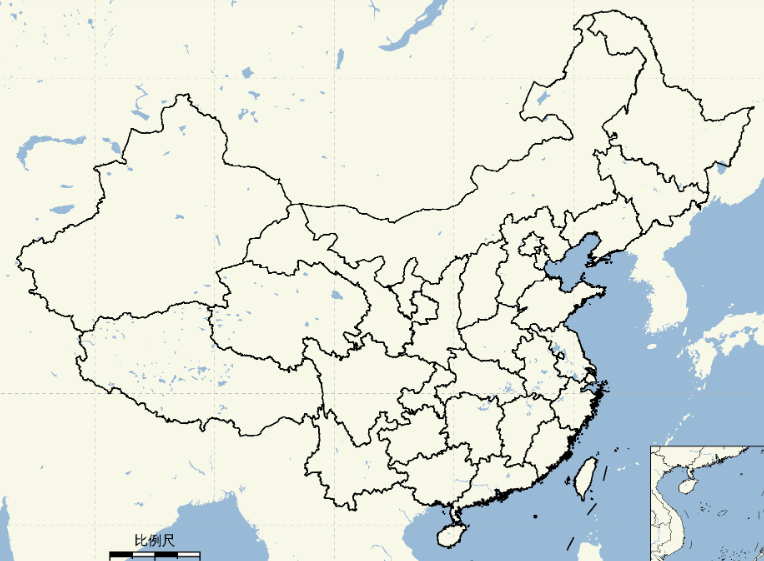
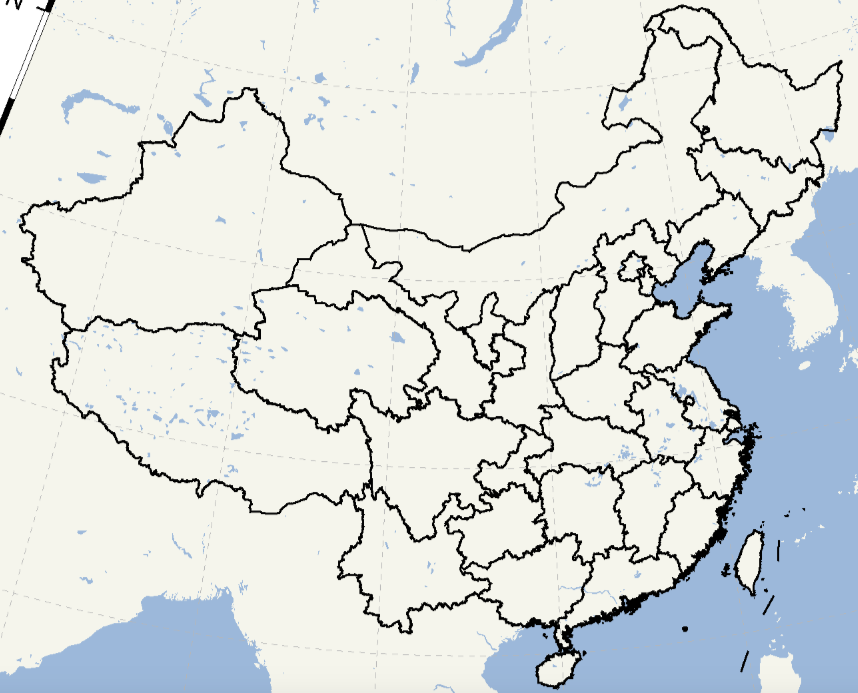
中国地图常见的错误
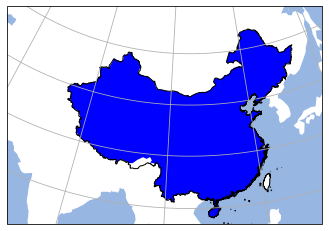
# import cartopy.io.shapereader as shapereader
shpfilename = shapereader.natural_earth(resolution='110m', \
                                      category='cultural', \
                                      name='admin_0_countries')

reader = shapereader.Reader(shpfilename)
countries = reader.records()

# Select the map projection
#----------------------
#ax = plt.axes(projection=ccrs.Mercator())
ax = plt.axes(projection=ccrs.LambertConformal(central_longitude=105, central_latitude=90,
                             false_easting=400000, false_northing=400000))
ax.add_feature(cfeat.OCEAN)

# Select the area of interest
#-----------------------
ax.set_extent([70, 130, 15, 55])

for country in countries:
    if country.attributes['ADM0_A3'] == 'CHN':
        ax.add_geometries([country.geometry], \
                          ccrs.PlateCarree(), \
                          facecolor=(0, 0, 1),
                          label=country.attributes['ADM0_A3'])
    else:
        ax.add_geometries([country.geometry], ccrs.PlateCarree(),
                          facecolor=(1, 1, 1), \
                          label=country.attributes['ADM0_A3'])

# China
shp = '../shp_file/china_country.shp'
rd = shapereader.Reader(shp)
china = cfeat.ShapelyFeature(rd.geometries(),ccrs.PlateCarree(), edgecolor='k', facecolor='none')
ax.add_feature(china,linewidth=1)
ax.gridlines(draw_labels=False)
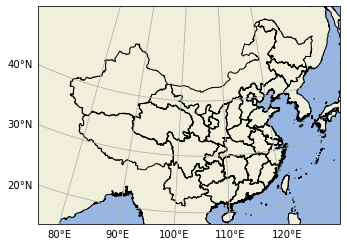
<cartopy.mpl.gridliner.Gridliner at 0x7fcea7565190>
states_provinces = cfeat.NaturalEarthFeature(category='cultural',
                                                name='admin_1_states_provinces',
                                                scale='10m', # 注意:需要较长时间下载数据
                                                facecolor='none')

ax = plt.axes(projection=ccrs.LambertConformal(central_longitude=105, central_latitude=90,
                             false_easting=400000, false_northing=400000))
ax.add_feature(cfeat.OCEAN)

# Select the area of interest
#-----------------------
ax.set_extent([70, 130, 15, 55])

reader = shapereader.Reader(shpfilename)
countries = reader.records()
for country in countries:
    if country.attributes['ADM0_A3'] == 'CHN':
        ax.add_geometries([country.geometry], \
                          ccrs.PlateCarree(), \
                          facecolor=(0, 0, 1),
                          label=country.attributes['ADM0_A3'])
    else:
        ax.add_geometries([country.geometry], ccrs.PlateCarree(),
                          facecolor=(1, 1, 1), \
                          label=country.attributes['ADM0_A3'])

# China provinces
shp = '../shp_file/china.shp'
rd = shapereader.Reader(shp)
provinces = cfeat.ShapelyFeature(rd.geometries(),ccrs.PlateCarree(), edgecolor='k', facecolor='none')
ax.add_feature(provinces,linewidth=1)
ax.add_feature(states_provinces, linewidth=1, edgecolor='red')
ax.gridlines(draw_labels=False)
<cartopy.mpl.gridliner.Gridliner at 0x7fcea8185390>
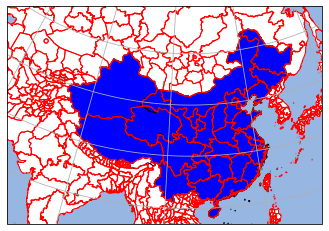
LambertConformal 坐标标注
由于
cartopy的局限,对于LambertConformal投影还无法标注坐标轴 (version <= 0.17)。这个问题在即将发布的 0.18 版本可望得到解决
Andrew Dawson 提供了一种临时解决方法 https://gist.github.com/ajdawson/dd536f786741e987ae4e
from copy import copy
import shapely.geometry as sgeom

def find_side(ls, side):
    """
    Given a shapely LineString which is assumed to be rectangular, return the
    line corresponding to a given side of the rectangle.

    """
    minx, miny, maxx, maxy = ls.bounds
    points = {'left': [(minx, miny), (minx, maxy)],
              'right': [(maxx, miny), (maxx, maxy)],
              'bottom': [(minx, miny), (maxx, miny)],
              'top': [(minx, maxy), (maxx, maxy)],}
    return sgeom.LineString(points[side])

def lambert_xticks(ax, ticks):
    """Draw ticks on the bottom x-axis of a Lambert Conformal projection."""
    te = lambda xy: xy[0]
    lc = lambda t, n, b: np.vstack((np.zeros(n) + t, np.linspace(b[2], b[3], n))).T
    xticks, xticklabels = _lambert_ticks(ax, ticks, 'bottom', lc, te)
    ax.xaxis.tick_bottom()
    ax.set_xticks(xticks)
    ax.set_xticklabels([ax.xaxis.get_major_formatter()(xtick) for xtick in xticklabels])

def lambert_yticks(ax, ticks):
    """Draw ricks on the left y-axis of a Lamber Conformal projection."""
    te = lambda xy: xy[1]
    lc = lambda t, n, b: np.vstack((np.linspace(b[0], b[1], n), np.zeros(n) + t)).T
    yticks, yticklabels = _lambert_ticks(ax, ticks, 'left', lc, te)
    ax.yaxis.tick_left()
    ax.set_yticks(yticks)
    ax.set_yticklabels([ax.yaxis.get_major_formatter()(ytick) for ytick in yticklabels])

def _lambert_ticks(ax, ticks, tick_location, line_constructor, tick_extractor):
    """Get the tick locations and labels for an axis of a Lambert Conformal projection."""
    outline_patch = sgeom.LineString(ax.outline_patch.get_path().vertices.tolist())
    axis = find_side(outline_patch, tick_location)
    n_steps = 30
    extent = ax.get_extent(ccrs.PlateCarree())
    _ticks = []
    for t in ticks:
        xy = line_constructor(t, n_steps, extent)
        proj_xyz = ax.projection.transform_points(ccrs.Geodetic(), xy[:, 0], xy[:, 1])
        xyt = proj_xyz[..., :2]
        ls = sgeom.LineString(xyt.tolist())
        locs = axis.intersection(ls)
        if not locs:
            tick = [None]
        else:
            tick = tick_extractor(locs.xy)
        _ticks.append(tick[0])
    # Remove ticks that aren't visible:
    ticklabels = copy(ticks)
    while True:
        try:
            index = _ticks.index(None)
        except ValueError:
            break
        _ticks.pop(index)
        ticklabels.pop(index)
    return _ticks, ticklabels
fig = plt.figure(figsize=(9, 8), frameon=True)
ax = fig.add_axes([0.08, 0.05, 0.8, 0.94],
                  projection=ccrs.LambertConformal(central_longitude=105, central_latitude=90,
                             false_easting=400000, false_northing=400000))
ax.add_feature(cfeat.OCEAN)

# Select the area of interest
#-----------------------
ax.set_extent([78, 130, 15, 53])

# *must* call draw in order to get the axis boundary used to add ticks:
fig.canvas.draw()

# Define gridline locations and draw the lines using cartopy's built-in gridliner:
xticks = [50, 60, 70, 80, 90, 100, 110, 120, 130, 140, 150]
yticks = [0, 10, 20, 30, 40, 50, 60]
ax.gridlines(xlocs=xticks, ylocs=yticks)

ax.xaxis.set_major_formatter(LONGITUDE_FORMATTER)
ax.yaxis.set_major_formatter(LATITUDE_FORMATTER)
lambert_xticks(ax, xticks)
lambert_yticks(ax, yticks)

ax.add_feature(provinces,linewidth=1)
shp = '../shp_file/china_nine_dotted_line.shp'
rd = shapereader.Reader(shp)
nine_dots = cfeat.ShapelyFeature(rd.geometries(),ccrs.PlateCarree(), edgecolor='k', facecolor='none')
ax.add_feature(nine_dots,linewidth=1)

ax_sub = fig.add_axes([0.748,0.19,0.14,0.155], projection=ccrs.LambertConformal(central_longitude=115, central_latitude=12,
                             false_easting=400000, false_northing=400000))
ax_sub.set_extent([105, 125, 0, 25])
ax_sub.add_feature(cfeat.OCEAN)
ax_sub.add_feature(nine_dots,linewidth=1.5)
ax_sub.add_feature(provinces,linewidth=0.5)
/opt/miniconda3/lib/python3.7/site-packages/ipykernel_launcher.py:37: DeprecationWarning: The outline_patch property is deprecated. Use GeoAxes.spines['geo'] or the default Axes properties instead.
<cartopy.mpl.feature_artist.FeatureArtist at 0x7fce553d3c90>
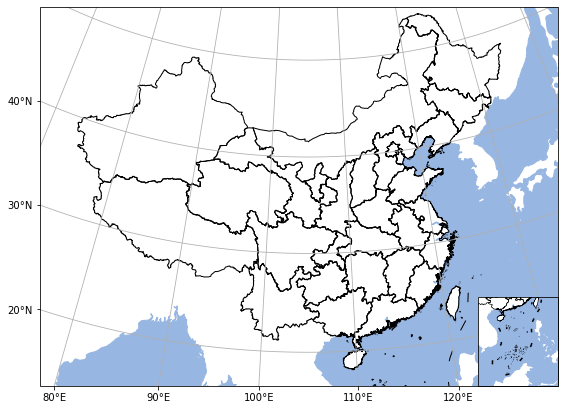
在 0.18 版本中,gridlines 对象进行了较大的修改,从而可以更好地进行坐标轴标记,但是也还存在一些问题。
lambert_crs = ccrs.LambertConformal(central_longitude=105)

ax0 = plt.axes(projection=lambert_crs)
ax0.set_extent([75, 130, 18, 54], crs=ccrs.PlateCarree())
ax0.add_feature(cfeat.LAND)
ax0.add_feature(cfeat.OCEAN)
#ax0.add_feature(cfeat.BORDERS)
ax0.add_feature(provinces,linewidth=1)
gl = ax0.gridlines(draw_labels=True, dms=True, x_inline=False, y_inline=False)
gl.xlocator = mticker.FixedLocator([80, 90, 100, 110, 120])
gl.ylocator = mticker.FixedLocator([20, 30, 40])
gl.rotate_labels = False
gl.top_labels = gl.right_labels = False
ax0.coastlines(resolution='10m')
<cartopy.mpl.feature_artist.FeatureArtist at 0x7fce553f1950>
