Matplotlib 进阶
Contents
Matplotlib 进阶
主讲人:李显祥
大气科学学院
from matplotlib import pyplot as plt
import numpy as np
%matplotlib inline
# 创建一些示例数据
import numpy as np
x = np.linspace(-np.pi, np.pi, 100)
y = np.cos(x)
z = np.sin(6*x)
Matplotlib 的几种调用方法
参考 https://matplotlib.org/faq/usage_faq.html#coding-styles:
pyplot方法
 import matplotlib.pyplot as plt
 plt.plot(x,y)
面向对象方法 (Object oriented)
 import matplotlib.pyplot as plt
 fig,ax = plt.subplots()
 ax.plot(x,y)
嵌入图形界面的调用方法
plt.plot(x, y)
[<matplotlib.lines.Line2D at 0x7f91e4537110>]
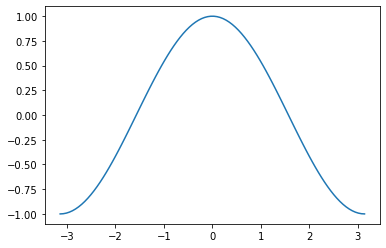

Figure 和 Axes
Figure 是 matplotlib 对象架构中的最高一级。 它可以用来直接显式创建一幅图。
fig = plt.figure()
<Figure size 432x288 with 0 Axes>
fig = plt.figure(figsize=(13, 5))
<Figure size 936x360 with 0 Axes>
Axes 是次一级的对象,它需要在 Figure 上创建。
fig = plt.figure()
ax = fig.add_axes([0, 0, 1, 1])
我们可以指定 Axes 占据 Figure 的多少空间 (左下角 x 坐标, 左下角 y 坐标, 宽度,高度)
fig = plt.figure()
ax = fig.add_axes([0, 0, 0.5, 1.0])
fig = plt.figure()
ax1 = fig.add_axes([0, 0, 0.5, 1])
ax2 = fig.add_axes([0.6, 0, 0.3, 0.5], facecolor='g')
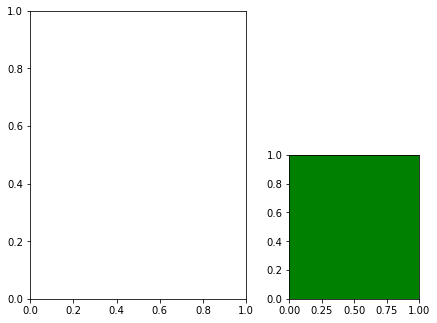
fig = plt.figure()
ax1 = fig.add_axes([0.1,0.1,0.8,0.8])
ax1.tick_params(left=False, bottom=False, labelbottom=False, labelleft=False)
ax2 = fig.add_axes([0.2,0.2,0.3,0.3])
ax2.tick_params(left=False, bottom=False, labelbottom=False, labelleft=False)

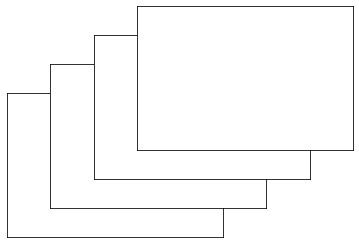
fig = plt.figure()
for i in range(4):
    ax = fig.add_axes([0.1*(i+1),0.1*(i+1),0.5,0.5])
    ax.tick_params(left=False, bottom=False,labelbottom=False, labelleft=False)
Subplots
plt.subplots 可以一次性创建多个 Axes
fig = plt.figure()
axes = fig.subplots(nrows=2, ncols=3)
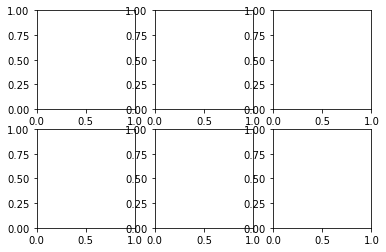
fig = plt.figure(figsize=(12, 6))
axes = fig.subplots(nrows=2, ncols=3)
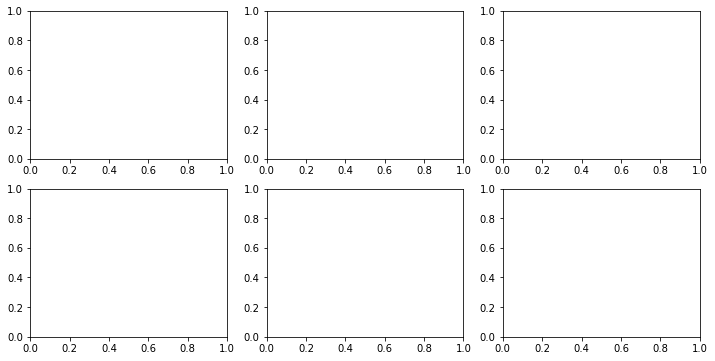
fig = plt.figure()
axes = fig.subplots(nrows=2, ncols=3, sharex=True, sharey=True)
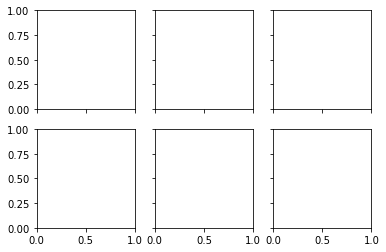
axes
array([[<AxesSubplot:>, <AxesSubplot:>, <AxesSubplot:>],
       [<AxesSubplot:>, <AxesSubplot:>, <AxesSubplot:>]], dtype=object)
我们可以同时创建 figure 和 Axes
这也是我们推荐的画图方式!
fig, ax = plt.subplots()
ax
<AxesSubplot:>
fig, axes = plt.subplots(ncols=2, figsize=(8, 4), subplot_kw={'facecolor': 'g'})
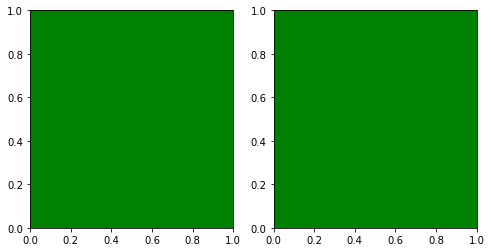
axes
array([<AxesSubplot:>, <AxesSubplot:>], dtype=object)
在 Axes 中绘图
所有的绘图操作都发生在 Axes 对象上. 如果你采用面向对象的方式来调用 matploblib,事情就会变得很容易理解.
fig, ax = plt.subplots()
ax.plot(x, y)
[<matplotlib.lines.Line2D at 0x7f91e6343650>]
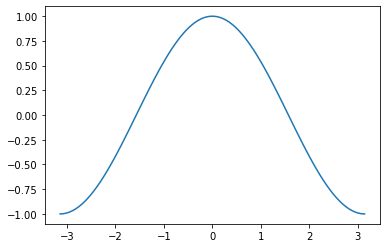
我们也可以用 pyplot 来画出同样的图 (见前面的示例)。
但是当我们要画多个子图的时候,面向对象的方法就显示出威力了。
#fig, axes = plt.subplots(figsize=(10, 4), ncols=2)
#ax0, ax1 = axes
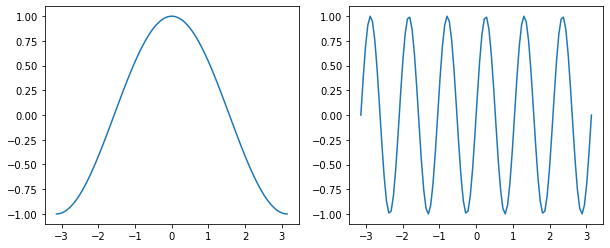
fig,[ax0,ax1] = plt.subplots(figsize=(10, 4), ncols=2)
ax0.plot(x, y)
ax1.plot(x, z)
[<matplotlib.lines.Line2D at 0x7f91e6435590>]
坐标轴标注 Labels
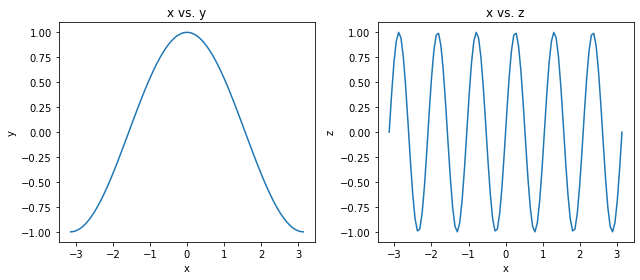
fig, (ax0, ax1) = plt.subplots(figsize=(9, 4), ncols=2)

ax0.plot(x, y)
ax0.set_xlabel('x')
ax0.set_ylabel('y')
ax0.set_title('x vs. y')

ax1.plot(x, z)
ax1.set_xlabel('x')
ax1.set_ylabel('z')
ax1.set_title('x vs. z')

# squeeze everything in
plt.tight_layout()
线型
fig, axes = plt.subplots(figsize=(20, 5), ncols=4)
axes[0].plot(x, y, linestyle='-')
axes[0].plot(x, z, linestyle='solid')

axes[1].plot(x, y, linestyle='dashed')
axes[1].plot(x, z, linestyle='--')

axes[2].plot(x, y, linestyle='dotted')
axes[2].plot(x, z, linestyle=':')

axes[3].plot(x, y, linestyle='dashdot', linewidth=5)
axes[3].plot(x, z, linestyle='-.', linewidth=0.5)
[<matplotlib.lines.Line2D at 0x7f91e4a7ac90>]

颜色
根据 colors documentation,有一常用些颜色有专门的名字:
b: blueg: greenr: redc: cyanm: magentay: yellowk: blackw: white
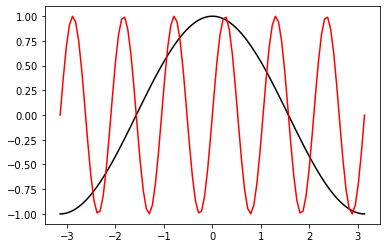
fig, ax = plt.subplots()
ax.plot(x, y, color='k')
ax.plot(x, z, color='r')
[<matplotlib.lines.Line2D at 0x7f91e4ad07d0>]
指定颜色的其它方式:
fig, axes = plt.subplots(figsize=(16, 5), ncols=3)

# grayscale
axes[0].plot(x, y, color='0.8')
axes[0].plot(x, z, color='0.2')

# RGB tuple
axes[1].plot(x, y, color=(1, 0, 0.7))
axes[1].plot(x, z, color=(0, 0.4, 0.3))

# HTML hex code
axes[2].plot(x, y, color='#00dcba')
axes[2].plot(x, z, color='#b029ee')
[<matplotlib.lines.Line2D at 0x7f91e4fb7290>]

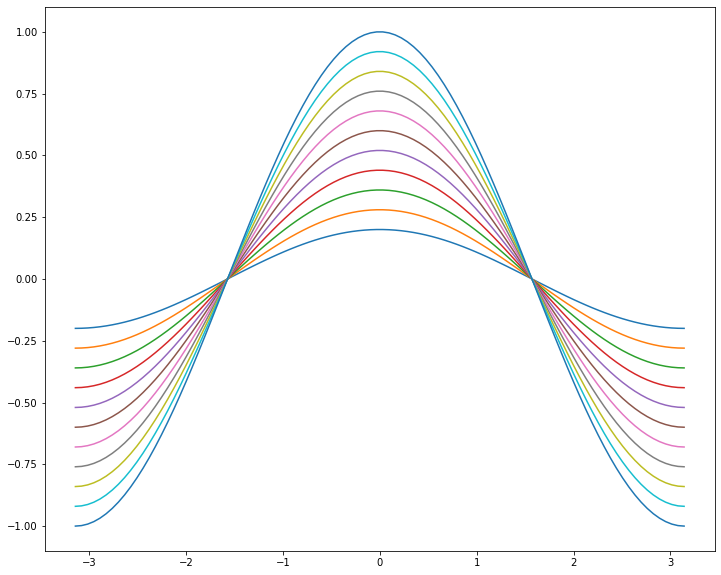
如果不指定颜色,matplotlib 内部会循环使用默认的颜色列表:
plt.rcParams['axes.prop_cycle']
| 'color' |
|---|
| '#1f77b4' |
| '#ff7f0e' |
| '#2ca02c' |
| '#d62728' |
| '#9467bd' |
| '#8c564b' |
| '#e377c2' |
| '#7f7f7f' |
| '#bcbd22' |
| '#17becf' |
fig, ax = plt.subplots(figsize=(12, 10))
for factor in np.linspace(0.2, 1, 11):
    ax.plot(x, factor*y)
Markers
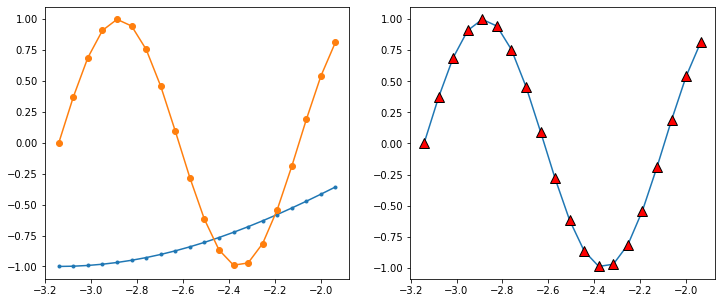
matplolib 里有很多不同的 markers 供选择!
fig, axes = plt.subplots(figsize=(12, 5), ncols=2)

axes[0].plot(x[:20], y[:20], marker='.')
axes[0].plot(x[:20], z[:20], marker='o')

axes[1].plot(x[:20], z[:20], marker='^',
             markersize=10, markerfacecolor='r',
             markeredgecolor='k')
[<matplotlib.lines.Line2D at 0x7f91e78f2350>]
标注、刻度和网格 Label, Ticks, and Gridlines
ax.set_xlabel()        ax.set_ylabel()

ax.set_xticks()        ax.set_yticks()

ax.set_xticklabels()   ax.set_yticklabels()
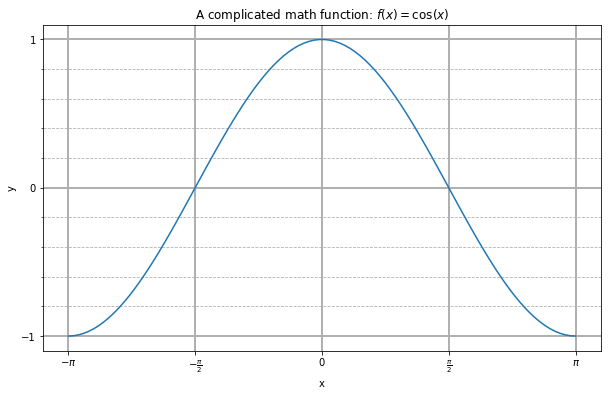
fig, ax = plt.subplots(figsize=(10, 6))
ax.plot(x, y)

ax.set_xlabel('x')
ax.set_ylabel('y')
ax.set_title(r'A complicated math function: $f(x) = \cos(x)$')

ax.set_xticks(np.pi * np.array([-1, -0.5, 0, 0.5, 1]))
ax.set_xticklabels([r'$-\pi$', r'$-\frac{\pi}{2}$', '0', r'$\frac{\pi}{2}$', r'$\pi$'])
ax.set_yticks([-1, 0, 1])

ax.set_yticks(np.arange(-1, 1.1, 0.2), minor=True)
#ax.set_xticks(np.arange(-3, 3.1, 0.2), minor=True)

ax.grid(which='minor', linestyle='--')
ax.grid(which='major', linewidth=2)
Axes.tick_params 可以用来调整坐标轴(包括刻度、标注)的属性,其参数包括
axis{‘x’, ‘y’, ‘both’} 指定操作的坐标轴; 默认值 ‘both’.reset布尔值, 默认值:False如果是True, 先将所有参数值重置为默认值,然后再处理其它参数.which{‘major’, ‘minor’, ‘both’} 默认值 ‘major’; 指定是操作主刻度还是次刻度.direction{‘in’, ‘out’, ‘inout’} 刻度的方向:朝内、朝外或者同时朝内外.length浮点数: 刻度的长度(单位:points).width浮点数: 刻度的宽度(单位:points).color,colors刻度的颜色pad浮点数: 刻度和标注之间的距离(单位:points).labelsize,labelcolor:标注的大小,颜色,bottom,top,left,right布尔值: 是否绘制相应的刻度.labelbottom,labeltop,labelleft,labelright布尔值:是否绘制相应的标注labelrotation浮点数:标注的旋转度数(逆时针方向为正)zorder:绘图元素的层数,数值越大,绘制的顺序越靠后(不容易被其它元素遮挡)
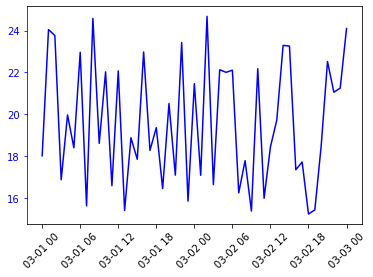
import pandas as pd

dates = pd.date_range('2020-03-01','2020-03-03',freq='H')
temp = 15+np.random.rand(len(dates))*10

fig,ax=plt.subplots()
ax.plot(dates,temp,color='b')

ax.tick_params(axis='x',labelrotation=45)
ax.tick_params(axis='y',color='b',labelcolor='b')
ax.spines['left'].set_color('b')
Spines
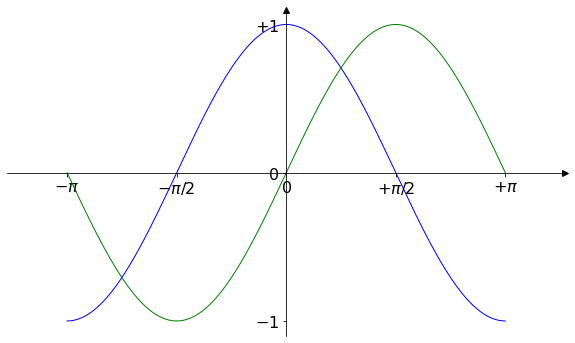
Axes 有四个 spines (即连接 ticks的直线),分别为 'left', 'right', 'bottom' 和 'top', 存放在 Axes.spines 这个有序字典(OrderedDict)里。
我们可以改变这些 spines 的属性,包括颜色和位置。
X = np.linspace(-np.pi, np.pi, 256,endpoint=True)
C,S = np.cos(X), np.sin(X)

fig,ax=plt.subplots(figsize=(10,6))
ax.plot(X, C, color="blue", linewidth=1.0, linestyle="-")
ax.plot(X, S, color="green", linewidth=1.0, linestyle="-")
ax.set_xlim(-4.0,4.0)
#ax.set_xticks(np.linspace(-4,4,9,endpoint=True))
ax.set_ylim(-1.10,1.10)
ax.set_xticks([-np.pi, -np.pi/2, 0, np.pi/2, np.pi])
ax.set_xticklabels([r'$-\pi$', r'$-\pi/2$', r'$0$', r'$+\pi/2$', r'$+\pi$'])
ax.set_yticks([-1, 0, +1])
ax.set_yticklabels([r'$-1$', r'$0$', r'$+1$'])
ax.tick_params(axis='both',labelsize=16)

ax.spines['right'].set_visible(False)
ax.spines['top'].set_visible(False)
ax.xaxis.set_ticks_position('bottom')
ax.spines['bottom'].set_position(('data',0))
ax.yaxis.set_ticks_position('left')
ax.spines['left'].set_position(('data',0))

ax.plot(1, 0, ">k", transform=ax.get_yaxis_transform(), clip_on=False)
ax.plot(0, 1, "^k", transform=ax.get_xaxis_transform(), clip_on=False)
[<matplotlib.lines.Line2D at 0x7f91ea1ef290>]
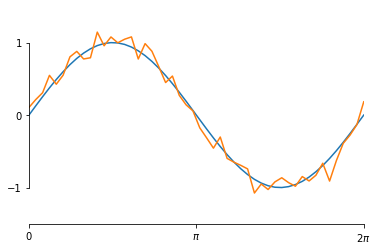
# https://matplotlib.org/3.3.3/gallery/ticks_and_spines/spines_bounds.html
# Fixing random state for reproducibility
np.random.seed(19680801)

x = np.linspace(0, 2*np.pi, 50)
y = np.sin(x)
y2 = y + 0.1 * np.random.normal(size=x.shape)

fig, ax = plt.subplots()
ax.plot(x, y)
ax.plot(x, y2)

# set ticks and tick labels
ax.set_xlim((0, 2*np.pi))
ax.set_xticks([0, np.pi, 2*np.pi])
ax.set_xticklabels(['0', r'$\pi$', r'2$\pi$'])
ax.set_ylim((-1.5, 1.5))
ax.set_yticks([-1, 0, 1])

# Only draw spine between the y-ticks
ax.spines['left'].set_bounds((-1, 1))
# Hide the right and top spines
ax.spines['right'].set_visible(False)
ax.spines['top'].set_visible(False)
fill_between
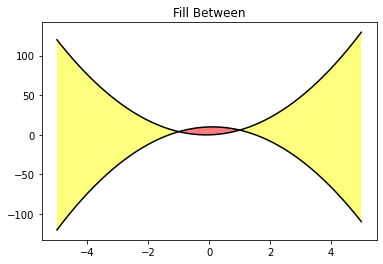
x = np.arange(-5, 5, 0.01)
y1 = -5*x*x + x + 10
y2 = 5*x*x + x

fig, ax = plt.subplots()
ax.plot(x, y1, x, y2, color='black')
ax.fill_between(x, y1, y2, where=y2>y1, facecolor='yellow', alpha=0.5)
ax.fill_between(x, y1, y2, where=y2<=y1, facecolor='red', alpha=0.5)
ax.set_title('Fill Between')
Text(0.5, 1.0, 'Fill Between')
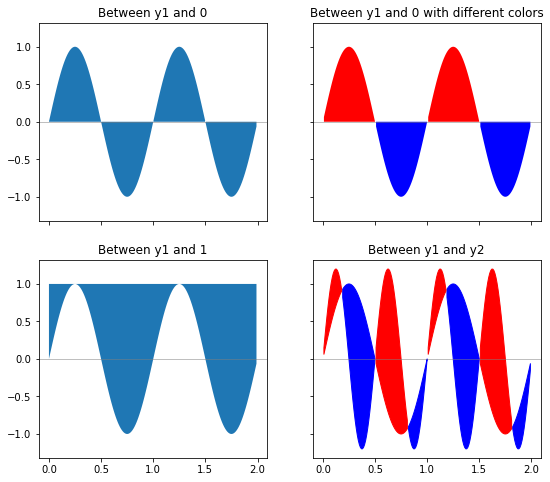
x = np.arange(0.0, 2, 0.01)
y1 = np.sin(2 * np.pi * x)
y2 = 1.2 * np.sin(4 * np.pi * x)

fig,ax = plt.subplots(2,2,sharex=True,sharey=True,figsize=(9, 8))
ax[0,0].fill_between(x,0,y1)
ax[0,0].axhline(0,color='grey',alpha=0.5,lw=1)
ax[0,0].set_title('Between y1 and 0')

ax[0,1].fill_between(x,0,y1,where=y1>0,facecolor='r')
ax[0,1].fill_between(x,0,y1,where=y1<0,facecolor='b')
ax[0,1].axhline(0,color='grey',alpha=0.5,lw=1)
ax[0,1].set_title('Between y1 and 0 with different colors')

ax[1,0].fill_between(x,y1,1)
ax[1,0].axhline(0,color='grey',alpha=0.5,lw=1)
ax[1,0].set_title('Between y1 and 1')

ax[1,1].fill_between(x,y1,y2,where=y1>y2,color='b')
ax[1,1].fill_between(x,y1,y2,where=y1<y2,color='r')
ax[1,1].axhline(0,color='grey',alpha=0.5,lw=1)
ax[1,1].set_title('Between y1 and y2')
Text(0.5, 1.0, 'Between y1 and y2')
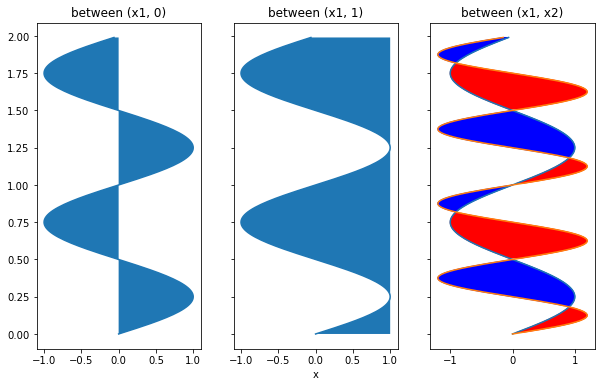
fill_between是对于y轴数据进行填充对应的也有
fill_betweenx来对x轴数据进行填充。
y = np.arange(0.0, 2, 0.01)
x1 = np.sin(2 * np.pi * y)
x2 = 1.2 * np.sin(4 * np.pi * y)

fig, [ax1, ax2, ax3] = plt.subplots(1, 3, sharey=True, figsize=(10, 6))
ax1.plot(x1,y)
ax1.fill_betweenx(y, 0, x1)
ax1.set_title('between (x1, 0)')
ax2.plot(x1,y)
ax2.fill_betweenx(y, x1, 1)
ax2.set_title('between (x1, 1)')
ax2.set_xlabel('x')
ax3.plot(x1,y,x2,y)
ax3.fill_betweenx(y, x1, x2,where=x1<x2,color='r')
ax3.fill_betweenx(y, x1, x2,where=x1>x2,color='b')
ax3.set_title('between (x1, x2)')
Text(0.5, 1.0, 'between (x1, x2)')
填充整个坐标轴
transform 参数:参照系的选择
ax.get_xaxis_transform(): 对
y轴使用坐标轴参照系,0 表示bottom, 1 表示topax.get_yaxis_transform(): 对
x轴使用坐标轴参照系,0 表示left, 1 表示right
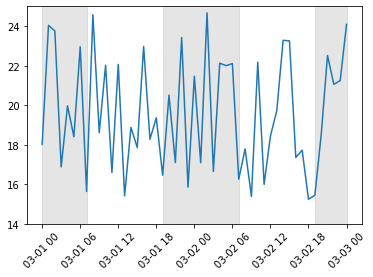
比如,我们对晚上的时间用灰色来填充。
fig,ax=plt.subplots()
ax.plot(dates,temp)
ax.set_ylim([14,25])
ax.tick_params(axis='x',labelrotation=45)
ax.fill_between(dates,0,1,where=(dates.hour<=7)|(dates.hour>=19),
               color='grey',alpha=0.2, transform=ax.get_xaxis_transform())
<matplotlib.collections.PolyCollection at 0x7f91ea1e6ed0>
Matplotlib styles
import matplotlib.pyplot as plt

plt.style.use('ggplot')

# 或者临时改变 style
with plt.style.context('ggplot'):
    fig, ax = plt.subplots()
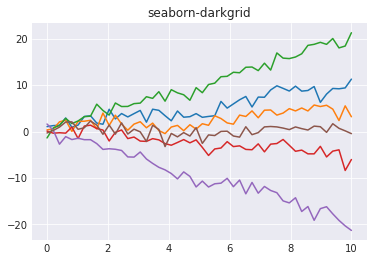
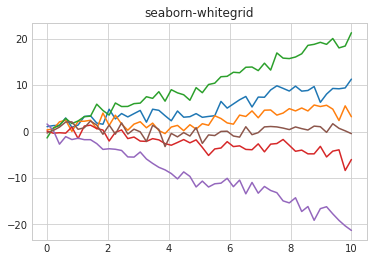
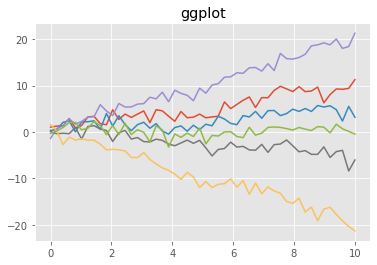
Matplotlib style sheets reference
总有一款适合你!
def plot_fig(style):
  x = np.linspace(0, 10)

  # Fixing random state for reproducibility
  np.random.seed(19680801)

  fig, ax = plt.subplots()

  ax.plot(x, np.sin(x) + x + np.random.randn(50))
  ax.plot(x, np.sin(x) + 0.5 * x + np.random.randn(50))
  ax.plot(x, np.sin(x) + 2 * x + np.random.randn(50))
  ax.plot(x, np.sin(x) - 0.5 * x + np.random.randn(50))
  ax.plot(x, np.sin(x) - 2 * x + np.random.randn(50))
  ax.plot(x, np.sin(x) + np.random.randn(50))
  ax.set_title(style)

for s in ['seaborn-darkgrid','seaborn-whitegrid','ggplot']:
    with plt.style.context(s):
        plot_fig(s)
图例 Legend
图例一般由以下部分组成
legend entry
A legend is made up of one or more legend entries. An entry is made up of exactly one key and one label.
legend key
The colored/patterned marker to the left of each legend label.
legend label
The text which describes the handle represented by the key.
legend handle
The original object which is used to generate an appropriate entry in the legend.
plt.legend, fig.legend
plt.legend()                     ax.legend()
plt.legend(labels)               ax.legend(labels)
plt.legend(handles, labels)      ax.legend(handles, labels)
如果不传递任何参数,则根据之前
plot生成的对象的label来产生图例图例的放置位置:
loc参数,默认为best,即自动选择最优位置(不保证是最优的!)。
其它位置为
位置
代号
‘best’
0
‘upper right’
1
‘upper left’
2
‘lower left’
3
‘lower right’
4
‘right’
5
‘center left’
6
‘center right’
7
‘lower center’
8
‘upper center’
9
‘center’
10
以下划线开头的
label将被legend自动排除
fig, ax = plt.subplots()
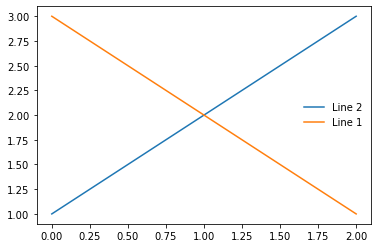
line_up, = ax.plot([1, 2, 3], label='Line 2')
line_down, = ax.plot([3, 2, 1], label='Line 1')
ax.legend(frameon=False)
<matplotlib.legend.Legend at 0x7f91eb013610>
fig, ax = plt.subplots()
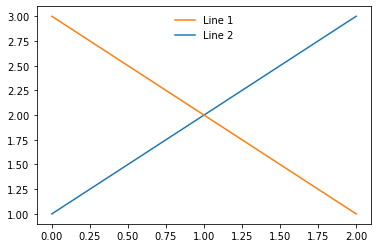
line_up, = ax.plot([1, 2, 3])
line_down, = ax.plot([3, 2, 1])
# plt.legend(handles, labels)
ax.legend([line_down, line_up], ['Line 1', 'Line 2'], loc='upper center', frameon=False)
<matplotlib.legend.Legend at 0x7f91ea7daad0>
我们也可以用 bbox_to_anchor 来指定 legend 位置,其形式为 [x,y,width,height],
前两个为相对于 ax 的位置,后两个为其大小(可省略)。
# Create plots with pre-defined labels.
fig, ax = plt.subplots()
ax.plot(x, y1, 'k--', label='Model length')
ax.plot(x, y2, 'k:', label='Data length')
ax.plot(x, y1 + y2, 'k', label='Total message length')

legend = ax.legend(bbox_to_anchor=(1.01,0.6), shadow=True, fontsize='x-large')

# Put a nicer background color on the legend.
legend.get_frame().set_facecolor('C6')
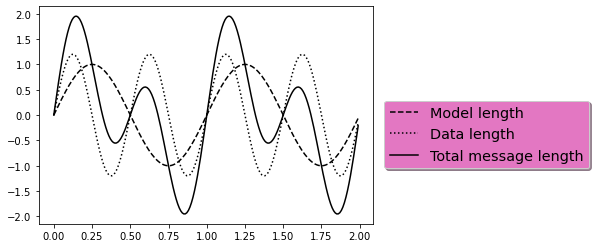
插图 Inset
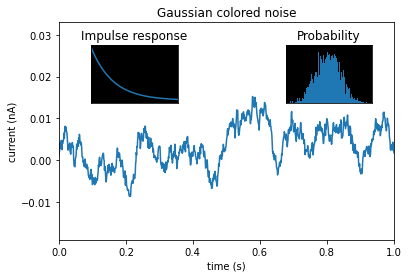
很多时候我们需要放置一张小图来表现一些细节(比如中国地图的南海小图),这时我们需要一个插图 (inset)。

可以用 fig.add_axes 来实现,其第一个参数为四个 float 组成的 list,分别表示插图的位置和大小 [x,y,width,height]。
np.random.seed(19680801)
# create some data to use for the plot
dt = 0.001
t = np.arange(0.0, 10.0, dt)
r = np.exp(-t[:1000] / 0.05)  # impulse response
x = np.random.randn(len(t))
s = np.convolve(x, r)[:len(x)] * dt  # colored noise

fig, main_ax = plt.subplots()
main_ax.plot(t, s)
main_ax.set_xlim(0, 1)
main_ax.set_ylim(1.1 * np.min(s), 2 * np.max(s))
main_ax.set_xlabel('time (s)')
main_ax.set_ylabel('current (nA)')
main_ax.set_title('Gaussian colored noise')

# this is an inset axes over the main axes
right_inset_ax = fig.add_axes([.65, .6, .2, .2], facecolor='k')
right_inset_ax.hist(s, 400, density=True)
right_inset_ax.set_title('Probability')
right_inset_ax.set_xticks([])
right_inset_ax.set_yticks([])

# this is another inset axes over the main axes
left_inset_ax = fig.add_axes([.2, .6, .2, .2], facecolor='k')
left_inset_ax.plot(t[:len(r)], r)
left_inset_ax.set_title('Impulse response')
left_inset_ax.set_xlim(0, 0.2)
left_inset_ax.set_xticks([])
left_inset_ax.set_yticks([])
[]
双x 或 y 轴
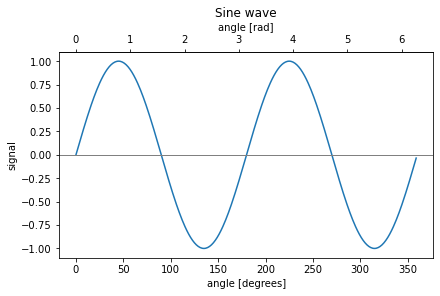
第一种情况
两个坐标轴绘制同一个数据,但显示不同的坐标数据,比如一个显示角度,一个显示弧度,或一个显示摄氏度,一个显示华氏度。
我们可以用 axes.Axes.secondary_xaxis 和 axes.Axes.secondary_yaxis 来实现这个效果.
我们需要提供一个 正向 和一个 反向 转换函数作为参数。
import datetime
import matplotlib.dates as mdates
from matplotlib.transforms import Transform
from matplotlib.ticker import AutoLocator, AutoMinorLocator

fig, ax = plt.subplots(constrained_layout=True)
dx = np.arange(0, 360, 1)
dy = np.sin(2 * dx * np.pi / 180)
ax.plot(dx, dy)
ax.set_xlabel('angle [degrees]')
ax.set_ylabel('signal')
ax.set_title('Sine wave')
ax.axhline(0, color='grey', linewidth=1)

def deg2rad(x):
    return x * np.pi / 180

def rad2deg(x):
    return x * 180 / np.pi

#xticks = [0, 0.5*np.pi, np.pi, 1.5*np.pi, 2*np.pi]
#labels = ['0', r'$\frac{\pi}{2}$', r'$\pi$', r'$\frac{3\pi}{2}$', r'$2\pi$']
secax = ax.secondary_xaxis('top', functions=(deg2rad, rad2deg)) #, xticks = xticks, xticklabels = labels)
secax.set_xlabel('angle [rad]')
Text(0.5, 0, 'angle [rad]')
fig, ax = plt.subplots(constrained_layout=True)
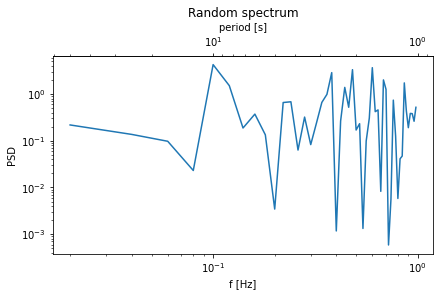
dx = np.arange(0.02, 1, 0.02)
np.random.seed(196808)
dy = np.random.randn(len(dx)) ** 2
ax.loglog(dx, dy)
ax.set_xlabel('f [Hz]')
ax.set_ylabel('PSD')
ax.set_title('Random spectrum')

def forward(x):
    return 1 / x

def inverse(x):
    return 1 / x

secax = ax.secondary_xaxis('top', functions=(forward, inverse))
secax.set_xlabel('period [s]')
Text(0.5, 0, 'period [s]')
/opt/miniconda3/lib/python3.7/site-packages/ipykernel_launcher.py:14: RuntimeWarning: divide by zero encountered in true_divide
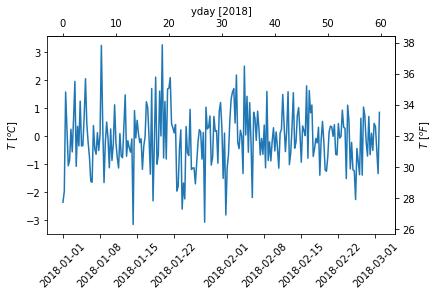
dates = [datetime.datetime(2018, 1, 1) + datetime.timedelta(hours=k * 6) for k in range(240)]
temperature = np.random.randn(len(dates))
fig, ax = plt.subplots(constrained_layout=True)

ax.plot(dates, temperature)
ax.set_ylabel(r'$T\ [^oC]$')
#plt.xticks(rotation=70)
#labels = ax.get_xticklabels()
#plt.setp(labels,rotation=70)
ax.tick_params('x',labelrotation=45)

def date2yday(x):
    """Convert matplotlib datenum to days since 2018-01-01."""
    y = x - mdates.date2num(datetime.datetime(2018, 1, 1))
    return y

def yday2date(x):
    """Return a matplotlib datenum for *x* days after 2018-01-01."""
    y = x + mdates.date2num(datetime.datetime(2018, 1, 1))
    return y

secaxx = ax.secondary_xaxis('top', functions=(date2yday, yday2date))
secaxx.set_xlabel('yday [2018]')

def CtoF(x):
    return x * 1.8 + 32

def FtoC(x):
    return (x - 32) / 1.8

secaxy = ax.secondary_yaxis('right', functions=(CtoF, FtoC))
secaxy.set_ylabel(r'$T\ [^oF]$')
Text(0, 0.5, '$T\\ [^oF]$')
第二种情况
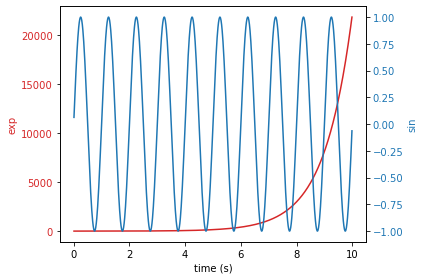
两个坐标轴来绘制不同的数据
axis.Axes.twinx: 两个y轴 (共享x轴)axis.Axes.twiny:两个x轴 (共享y轴)
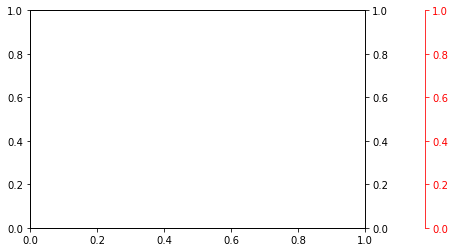
这两个函数可以调用多次,以生成更多的 x 或 y 轴,但是注意它们会叠加在一起,需要挪动它们的位置来同时显示它们。
t = np.arange(0.01, 10.0, 0.01)
data1 = np.exp(t)
data2 = np.sin(2 * np.pi * t)

fig, ax1 = plt.subplots()

color = 'tab:red'
ax1.set_xlabel('time (s)')
ax1.set_ylabel('exp', color=color)
ax1.plot(t, data1, color=color)
ax1.tick_params(axis='y', labelcolor=color)

ax2 = ax1.twinx()  # instantiate a second axes that shares the same x-axis

color = 'tab:blue'
ax2.set_ylabel('sin', color=color)  # we already handled the x-label with ax1
ax2.plot(t, data2, color=color)
ax2.tick_params(axis='y', labelcolor=color)

fig.tight_layout()  # otherwise the right y-label is slightly clipped
fig,ax1 = plt.subplots()
ax2 = ax1.twinx()   # 第二个 y 轴
ax3 = ax1.twinx()   # 第三个 y 轴

ax3.spines['right'].set_position(('outward',60))
ax3.spines['right'].set_color('red')
ax3.tick_params(axis='y',color='red',labelcolor='red')
时间坐标轴
插入标注文本 Annotations
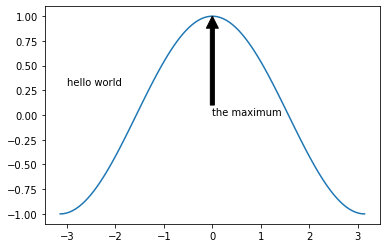
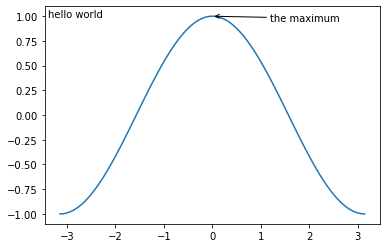
ax.textax.annotatetransform参数:参照系的选择ax.transData,ax.transAxes
fig, ax = plt.subplots()

x = np.linspace(-np.pi, np.pi, 100)
y = np.cos(x)

ax.plot(x, y)
ax.text(-3, 0.3, 'hello world')
ax.annotate('the maximum', xy=(0, 1),
             xytext=(0, 0), arrowprops={'facecolor': 'k'})
Text(0, 0, 'the maximum')
fig, ax = plt.subplots()

x = np.linspace(-np.pi, np.pi, 100)
y = np.cos(x)

ax.plot(x, y)
ax.text(0.01, 0.95, 'hello world', transform=ax.transAxes) # 注意参照系的选择 ax.transAxes
ax.annotate('the maximum', xy=(0, 1),
             xytext=(1.2, 0.95), arrowprops={'facecolor': 'k','arrowstyle': '->'})
Text(1.2, 0.95, 'the maximum')
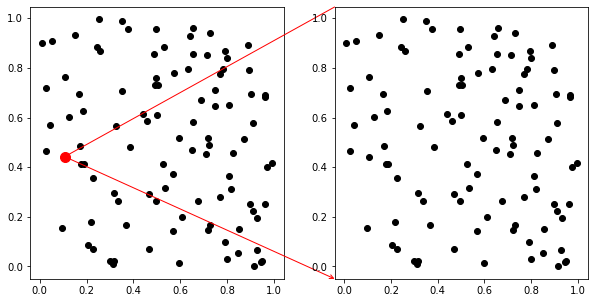
不同 subplot 间绘制辅助线
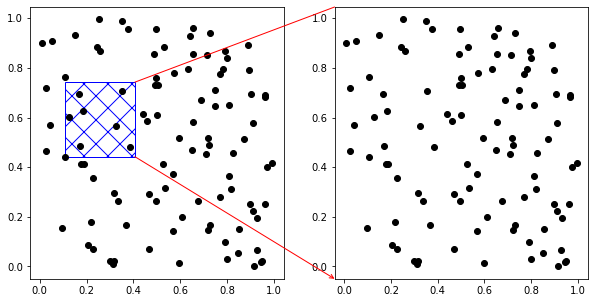
matplotlib.patches.ConnectionPath可以在不同子图间绘制连接线同样需要选择不同的参照系
‘data’‘axes fraction’: 左下角(0,0),右上角(1,1)
from matplotlib.patches import ConnectionPatch

fig = plt.figure(figsize=(10,5))
ax1 = fig.add_subplot(121)
ax2 = fig.add_subplot(122)

np.random.seed(12345)
datax, datay = np.random.rand(100),np.random.rand(100)

ax1.plot(datax,datay,'ko')
ax2.plot(datax,datay,'ko')

xy=(datax[13],datay[13])
con1 = ConnectionPatch(xyA=xy, xyB=(0,0),coordsA="data", coordsB="axes fraction",
                      arrowstyle='->', axesA=ax1, axesB=ax2, color='red')
con2 = ConnectionPatch(xyA=xy, xyB=(0,1),coordsA="data", coordsB="axes fraction",
                      axesA=ax1, axesB=ax2, color='red')

ax2.add_artist(con1)
ax2.add_artist(con2)

ax1.plot(datax[13],datay[13],'ro',markersize=10)
[<matplotlib.lines.Line2D at 0x7f91cce27450>]
#mport numpy as np
#from matplotlib.patches import ConnectionPatch
from matplotlib.patches import Rectangle

fig = plt.figure(figsize=(10,5))
ax1 = fig.add_subplot(121)
ax2 = fig.add_subplot(122)

np.random.seed(12345)
datax, datay = np.random.rand(100),np.random.rand(100)

ax1.plot(datax,datay,'ko')
ax2.plot(datax,datay,'ko')

xy=(datax[13],datay[13])
rect = Rectangle(xy,width=0.3,height=0.3,hatch='x',fill=False,edgecolor='b')
ax1.add_patch(rect)
[[x0,y0],[x1,y1]] = rect.get_bbox().get_points()  # vertices of the rectangle

con1 = ConnectionPatch(xyA=(x1,y0), xyB=(0,0),coordsA="data", coordsB="axes fraction",
                      arrowstyle='->', axesA=ax1, axesB=ax2, color='red',zorder=10)
con2 = ConnectionPatch(xyA=(x1,y1), xyB=(0,1),coordsA="data", coordsB="axes fraction",
                      axesA=ax1, axesB=ax2, color='red',zorder=10)

ax2.add_artist(con1)
ax2.add_artist(con2)
<matplotlib.patches.ConnectionPatch at 0x7f91cd16e710>
输出文件
plt.savefig, fig.savefig
参数:
文件名:根据后缀名决定保存的文件格式,
png,jpg,gif,eps,pdf,svg…dpi:dots per inch,图片的精度,出版的图片一般要求dpi > 300。bbox_inches="tight":让保存的图片更加紧凑,去掉周边的空白
动画

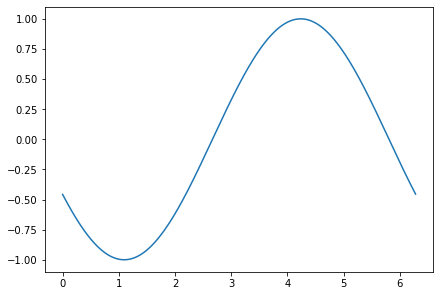
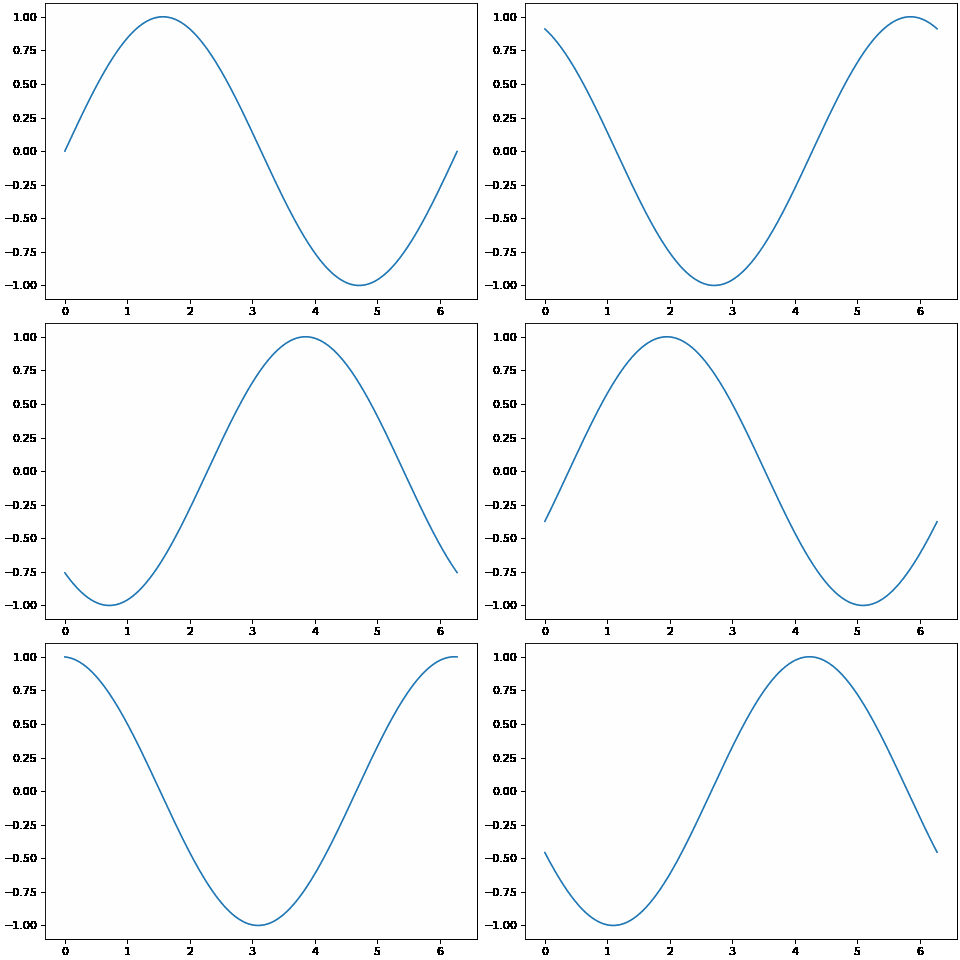
Matplotlib.animation 子模块可以用来生成动画。主要函数是 FuncAnimation 和 ArtistAnimation。
FuncAnimation(fig, func, frames=None, init_func=None, fargs=None, save_count=None, *, cache_frame_data=True, **kwargs)
fig: 绘制动画的 Figure 对象func: callable,每个帧(frame)调用的绘图函数,其参数从frames获得frames: iterable, int, generator function, or None, 可省略。传给func的数据,每次传一个,如果省略,则默认为100.save_count: int, default: 100。保存的帧数。interval: number, 可省略,默认200。两帧之间的延时,单位是毫秒(milliseconds)。
import matplotlib.animation as animation

fig, ax = plt.subplots(constrained_layout=True)

x = np.arange(0, 2*np.pi, 0.01)
line, = ax.plot(x, np.sin(x))

def init():  # only required for blitting to give a clean slate.
    line.set_ydata([np.nan] * len(x))
    return line,

def animate(i):
    line.set_ydata(np.sin(x + i / 10))  # update the data.
    return line,

ani = animation.FuncAnimation(
    fig, animate, init_func=init, interval=2, blit=True)

ani.save("movie.gif" , dpi=80)

# from matplotlib.animation import FFMpegWriter
# writer = FFMpegWriter(fps=15, metadata=dict(artist='Me'), bitrate=1800)
# ani.save("movie.mp4", writer=writer)
MovieWriter ffmpeg unavailable; using Pillow instead.
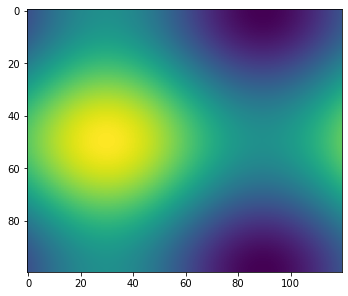
或者,我们也可以直接生成一些图片,把它们串起来。
import matplotlib.animation as animation

fig = plt.figure(constrained_layout=True)

def f(x, y):
    return np.sin(x) + np.cos(y)

x = np.linspace(0, 2 * np.pi, 120)
y = np.linspace(0, 2 * np.pi, 100).reshape(-1, 1)

ims = []
for i in range(60):
    x += np.pi / 15.
    y += np.pi / 20.
    im = plt.imshow(f(x, y), animated=True)
    ims.append([im])

ani = animation.ArtistAnimation(fig, ims, interval=50, blit=True, repeat_delay=1000)
ani.save('movie2.gif',dpi=80)
MovieWriter ffmpeg unavailable; using Pillow instead.

绘制复杂的 subplot
import matplotlib.gridspec as gridspec

fig2 = plt.figure(constrained_layout=True)
spec2 = gridspec.GridSpec(ncols=2, nrows=2, figure=fig2)
f2_ax1 = fig2.add_subplot(spec2[0, 0])
f2_ax2 = fig2.add_subplot(spec2[0, 1])
f2_ax3 = fig2.add_subplot(spec2[1, 0])
f2_ax4 = fig2.add_subplot(spec2[1, 1])
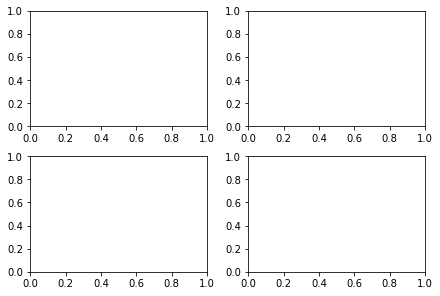
fig3 = plt.figure(constrained_layout=True)
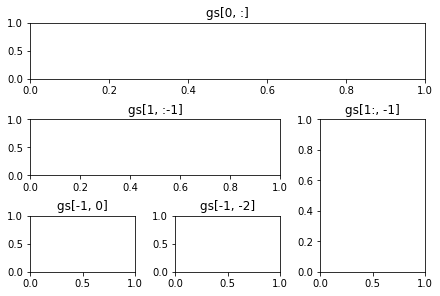
gs = fig3.add_gridspec(3, 3)
f3_ax1 = fig3.add_subplot(gs[0, :])
f3_ax1.set_title('gs[0, :]')
f3_ax2 = fig3.add_subplot(gs[1, :-1])
f3_ax2.set_title('gs[1, :-1]')
f3_ax3 = fig3.add_subplot(gs[1:, -1])
f3_ax3.set_title('gs[1:, -1]')
f3_ax4 = fig3.add_subplot(gs[-1, 0])
f3_ax4.set_title('gs[-1, 0]')
f3_ax5 = fig3.add_subplot(gs[-1, -2])
f3_ax5.set_title('gs[-1, -2]')
Text(0.5, 1.0, 'gs[-1, -2]')

def format_axes(fig):
    for i, ax in enumerate(fig.axes):
        ax.text(0.5, 0.5, "ax%d" % (i+1), va="center", ha="center")
        ax.tick_params(labelbottom=False, labelleft=False)

# gridspec inside gridspec
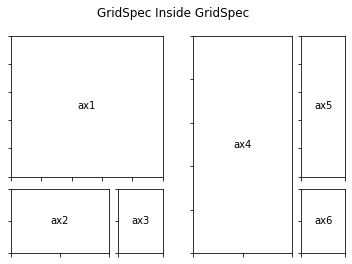
f = plt.figure()

gs0 = gridspec.GridSpec(1, 2, figure=f)

gs00 = gridspec.GridSpecFromSubplotSpec(3, 3, subplot_spec=gs0[0])

ax1 = f.add_subplot(gs00[:-1, :])
ax2 = f.add_subplot(gs00[-1, :-1])
ax3 = f.add_subplot(gs00[-1, -1])

# the following syntax does the same as the GridSpecFromSubplotSpec call above:
gs01 = gs0[1].subgridspec(3, 3)

ax4 = f.add_subplot(gs01[:, :-1])
ax5 = f.add_subplot(gs01[:-1, -1])
ax6 = f.add_subplot(gs01[-1, -1])

plt.suptitle("GridSpec Inside GridSpec")
format_axes(f)
以下是另外一种实现方法
# gridspec inside gridspec
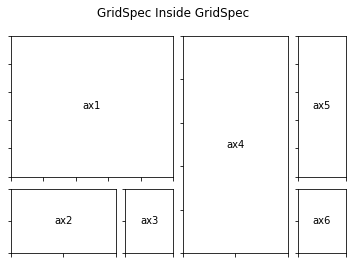
f = plt.figure()

gs0 = gridspec.GridSpec(3, 6, figure=f, wspace=0.2)

ax1 = f.add_subplot(gs0[:-1, 0:3])
ax2 = f.add_subplot(gs0[-1, 0:2])
ax3 = f.add_subplot(gs0[-1, 2])

ax4 = f.add_subplot(gs0[:, 3:-1])
ax5 = f.add_subplot(gs0[:-1, -1])
ax6 = f.add_subplot(gs0[-1, -1])

plt.suptitle("GridSpec Inside GridSpec")
format_axes(f)
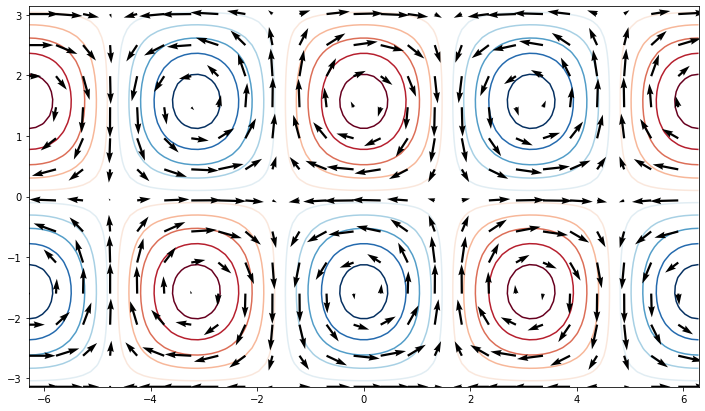
矢量箭头 quiver
x1d = np.linspace(-2*np.pi, 2*np.pi, 100)
y1d = np.linspace(-np.pi, np.pi, 50)
xx, yy = np.meshgrid(x1d, y1d)
f = np.cos(xx) * np.sin(yy)
clevels = np.arange(-1, 1, 0.2) + 0.1

u = -np.cos(xx) * np.cos(yy)
v = -np.sin(xx) * np.sin(yy)

fig, ax = plt.subplots(figsize=(12, 7))
ax.contour(xx, yy, f, clevels, cmap='RdBu_r', extend='both', zorder=0)
ax.quiver(xx[::4, ::4], yy[::4, ::4],
           u[::4, ::4], v[::4, ::4], zorder=1)
<matplotlib.quiver.Quiver at 0x7f91ce31ec50>
流线图 streamplot
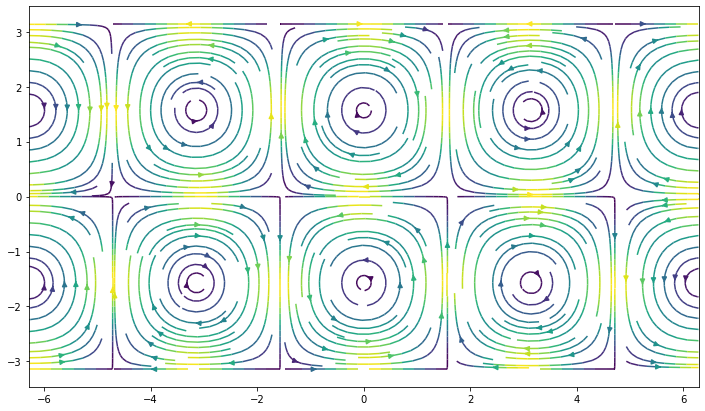
fig, ax = plt.subplots(figsize=(12, 7))
ax.streamplot(xx, yy, u, v, density=2, color=(u**2 + v**2))
<matplotlib.streamplot.StreamplotSet at 0x7f91ceb0ef90>
中文字体
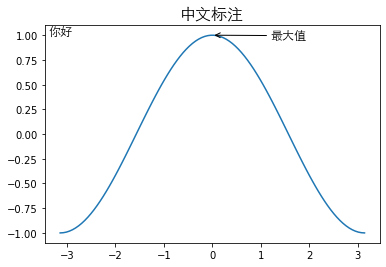
Matplotlib 默认的字体不支持中文;我们必须指定支持中文的字体。
matplotlib.font_manager 可以用来管理字体
import matplotlib as mpl

# 请使用你的电脑上的字体文件
myfont = mpl.font_manager.FontProperties(fname='/System/Library/Fonts/STHeiti Light.ttc') # Mac 字体文件
#myfont = mpl.font_manager.FontProperties(fname='C:\Windows\Fonts\STXIHEI.TTF') # Windows 字体文件

fig, ax = plt.subplots()

x = np.linspace(-np.pi, np.pi, 100)
y = np.cos(x)

ax.plot(x, y)
ax.text(0.01, 0.95, '你好', transform=ax.transAxes, fontproperties=myfont, fontsize=12) # 参照系选择
ax.annotate('最大值', xy=(0, 1),
             xytext=(1.2, 0.95), arrowprops={'facecolor': 'k','arrowstyle': '->'},
             fontproperties=myfont, fontsize=12)
ax.set_title('中文标注',fontproperties=myfont, fontsize=16)
Text(0.5, 1.0, '中文标注')
Pandas 绘图
import pandas as pd
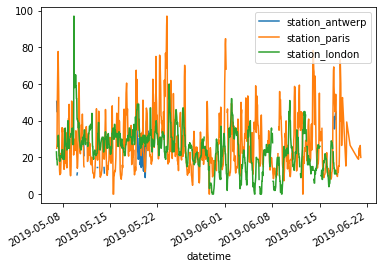
air_quality = pd.read_csv("air_quality_no2.csv", index_col=0, parse_dates=True)
air_quality.head()
| station_antwerp | station_paris | station_london | |
|---|---|---|---|
| datetime | |||
| 2019-05-07 02:00:00 | NaN | NaN | 23.0 |
| 2019-05-07 03:00:00 | 50.5 | 25.0 | 19.0 |
| 2019-05-07 04:00:00 | 45.0 | 27.7 | 19.0 |
| 2019-05-07 05:00:00 | NaN | 50.4 | 16.0 |
| 2019-05-07 06:00:00 | NaN | 61.9 | NaN |
air_quality.plot()
<AxesSubplot:xlabel='datetime'>
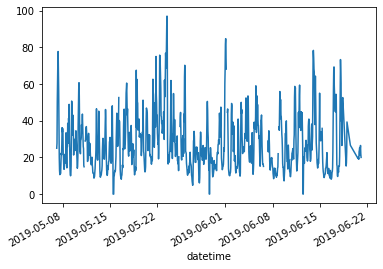
air_quality["station_paris"].plot()
<AxesSubplot:xlabel='datetime'>
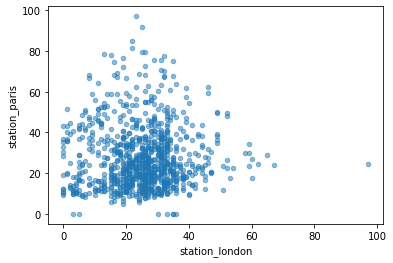
air_quality.plot.scatter(x="station_london", y="station_paris", alpha=0.5)
<AxesSubplot:xlabel='station_london', ylabel='station_paris'>
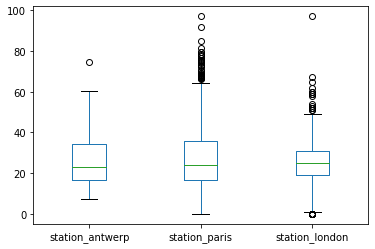
air_quality.plot.box() # 箱线图
<AxesSubplot:>
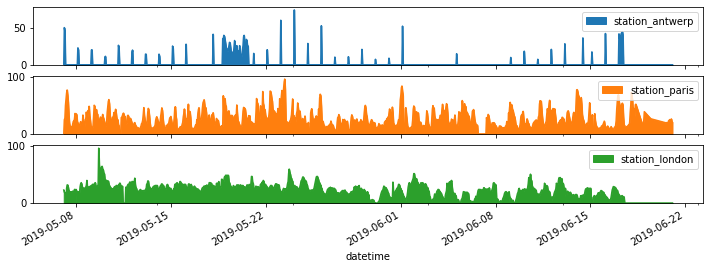
axs = air_quality.plot.area(figsize=(12, 4), subplots=True)
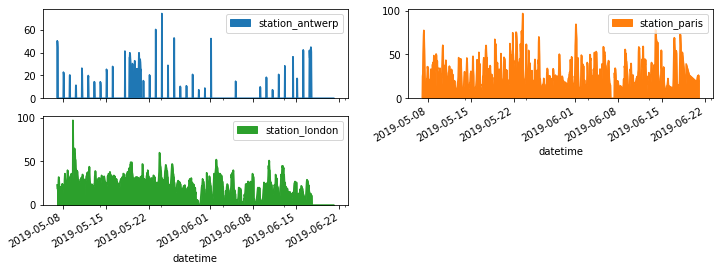
axs = air_quality.plot.area(figsize=(12, 4), subplots=True, layout=(2,2))
# 参考 https://matplotlib.org/3.3.3/api/dates_api.html
import matplotlib.dates as mdates

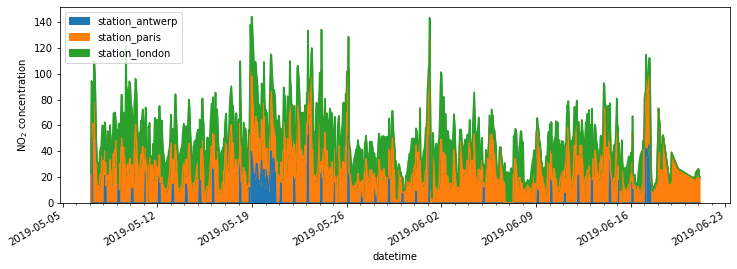
fig, axs = plt.subplots(figsize=(12, 4))
air_quality.plot.area(ax=axs)
axs.set_ylabel("NO$_2$ concentration")

dayLocator = mdates.DayLocator(bymonthday=(1,15))
#dayLocator = mdates.MonthLocator(bymonthday=(1,15))
#dayFormatter = mdates.DateFormatter('%Y-%m-%d')
axs.xaxis.set_major_locator(mdates.AutoDateLocator(interval_multiples=False)) #(dayLocator)
axs.xaxis.set_minor_locator(mdates.DayLocator(interval=1))
#axs.xaxis.set_major_formatter(dayFormatter)
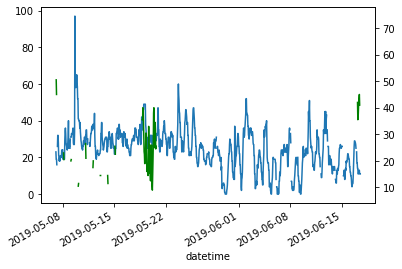
air_quality['station_london'].plot()
air_quality['station_antwerp'].plot(secondary_y=True, style='g')
<AxesSubplot:label='ddea9f5f-d870-4902-ab9b-89703a9156db'>
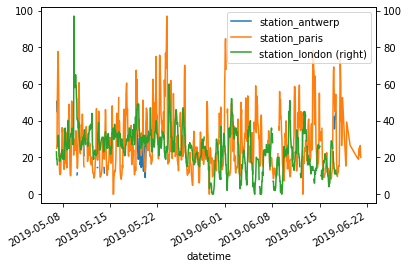
air_quality.plot(secondary_y=['station_london']) #, mark_right=False)
<AxesSubplot:xlabel='datetime'>
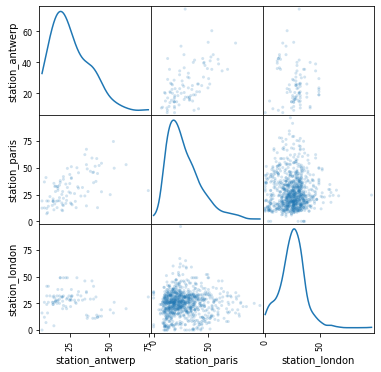
from pandas.plotting import scatter_matrix

scatter_matrix(air_quality, alpha=0.2, figsize=(6, 6), diagonal='kde');
Colorbar 和 colormap
Colormap 参考 https://matplotlib.org/tutorials/colors/colormaps.html#sphx-glr-tutorials-colors-colormaps-py
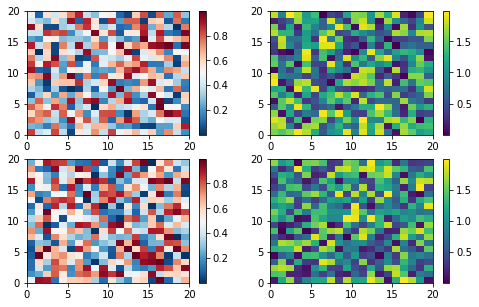
多图共用一个 colorbar
fig, axs = plt.subplots(2, 2, figsize=(8,5))
cm = ['RdBu_r', 'viridis']
for col in range(2):
    for row in range(2):
        ax = axs[row, col]
        pcm = ax.pcolormesh(np.random.random((20, 20)) * (col + 1), cmap=cm[col])
        fig.colorbar(pcm, ax=ax)
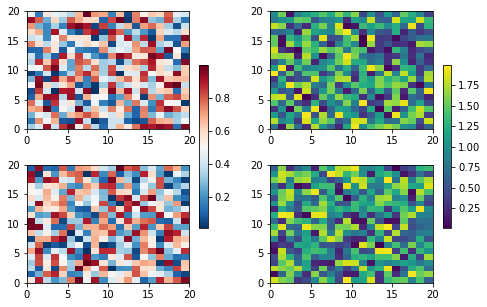
fig, axs = plt.subplots(2, 2, figsize=(8,5))
fig.subplots_adjust(wspace=0.2, hspace=0.3)
cm = ['RdBu_r', 'viridis']

for col in range(2):
    for row in range(2):
        ax = axs[row, col]
        pcm = ax.pcolormesh(np.random.random((20, 20)) * (col + 1), cmap=cm[col])
    fig.colorbar(pcm, ax=axs[:, col], shrink=0.6)
思考:如果上面4幅图要使用同一个 colorbar,该怎么办?
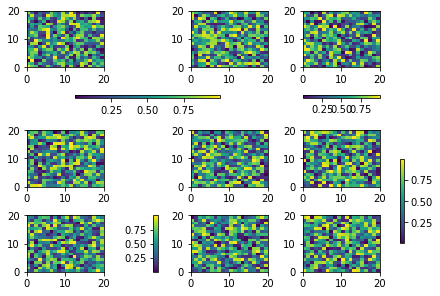
fig, axs = plt.subplots(3, 3, constrained_layout=True)
for ax in axs.flat:
    pcm = ax.pcolormesh(np.random.random((20, 20)))

fig.colorbar(pcm, ax=axs[0, :2], shrink=0.6, location='bottom')
fig.colorbar(pcm, ax=[axs[0, 2]], location='bottom')
fig.colorbar(pcm, ax=axs[1:, :], location='right', shrink=0.6)
fig.colorbar(pcm, ax=[axs[2, 1]], location='left')
<matplotlib.colorbar.Colorbar at 0x7f91d1a8c650>
